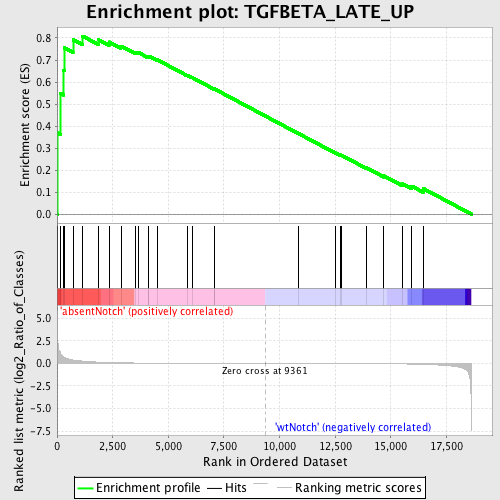
Profile of the Running ES Score & Positions of GeneSet Members on the Rank Ordered List
| Dataset | Set_03_absentNotch_versus_wtNotch.phenotype_absentNotch_versus_wtNotch.cls #absentNotch_versus_wtNotch.phenotype_absentNotch_versus_wtNotch.cls #absentNotch_versus_wtNotch_repos |
| Phenotype | phenotype_absentNotch_versus_wtNotch.cls#absentNotch_versus_wtNotch_repos |
| Upregulated in class | absentNotch |
| GeneSet | TGFBETA_LATE_UP |
| Enrichment Score (ES) | 0.80847454 |
| Normalized Enrichment Score (NES) | 1.5687852 |
| Nominal p-value | 0.013592233 |
| FDR q-value | 0.36297062 |
| FWER p-Value | 0.996 |
| PROBE | DESCRIPTION (from dataset) | GENE SYMBOL | GENE_TITLE | RANK IN GENE LIST | RANK METRIC SCORE | RUNNING ES | CORE ENRICHMENT | |
|---|---|---|---|---|---|---|---|---|
| 1 | IGFBP4 | 2680309 5420441 | 31 | 2.383 | 0.3689 | Yes | ||
| 2 | TNFRSF1A | 1090390 6520735 | 146 | 1.196 | 0.5487 | Yes | ||
| 3 | MTA1 | 3830092 | 296 | 0.729 | 0.6540 | Yes | ||
| 4 | WNT8B | 4560301 | 336 | 0.663 | 0.7550 | Yes | ||
| 5 | THBS2 | 2850136 | 717 | 0.371 | 0.7923 | Yes | ||
| 6 | RAC1 | 4810687 | 1146 | 0.252 | 0.8085 | Yes | ||
| 7 | MMP2 | 2570603 | 1854 | 0.141 | 0.7923 | No | ||
| 8 | NEO1 | 1990154 | 2335 | 0.099 | 0.7819 | No | ||
| 9 | PAK2 | 360438 7050068 | 2871 | 0.066 | 0.7634 | No | ||
| 10 | EFNA5 | 460707 2190519 | 3518 | 0.042 | 0.7352 | No | ||
| 11 | SMO | 5340538 6350132 | 3643 | 0.038 | 0.7344 | No | ||
| 12 | ARHGAP1 | 2810010 5270064 | 4087 | 0.029 | 0.7152 | No | ||
| 13 | COL16A1 | 1780520 | 4126 | 0.029 | 0.7176 | No | ||
| 14 | TNC | 670053 1780039 1980020 3060411 4780091 6860433 | 4492 | 0.023 | 0.7015 | No | ||
| 15 | ITGA5 | 5550520 | 5859 | 0.012 | 0.6299 | No | ||
| 16 | COL8A1 | 4590050 | 6067 | 0.011 | 0.6204 | No | ||
| 17 | EPHB4 | 2480037 | 7055 | 0.007 | 0.5684 | No | ||
| 18 | FGD1 | 4780021 | 7066 | 0.006 | 0.5688 | No | ||
| 19 | SEMA3F | 5420601 6770731 | 10857 | -0.004 | 0.3656 | No | ||
| 20 | ITGB3 | 5270463 | 12509 | -0.010 | 0.2784 | No | ||
| 21 | ITGA4 | 2470739 | 12716 | -0.011 | 0.2691 | No | ||
| 22 | DVL3 | 360156 5390075 | 12802 | -0.012 | 0.2664 | No | ||
| 23 | THBS1 | 4560494 430288 | 13904 | -0.021 | 0.2105 | No | ||
| 24 | EPHA2 | 5890056 | 14688 | -0.033 | 0.1735 | No | ||
| 25 | MMP11 | 1980619 | 15532 | -0.058 | 0.1371 | No | ||
| 26 | EPHB2 | 1090288 1410377 2100541 | 15929 | -0.075 | 0.1276 | No | ||
| 27 | MMP17 | 1850278 | 16452 | -0.109 | 0.1164 | No |

