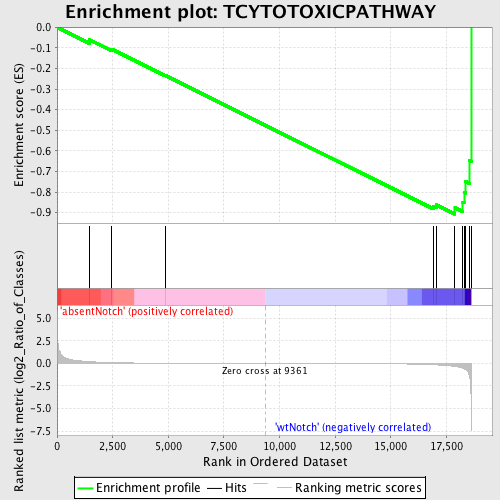
Profile of the Running ES Score & Positions of GeneSet Members on the Rank Ordered List
| Dataset | Set_03_absentNotch_versus_wtNotch.phenotype_absentNotch_versus_wtNotch.cls #absentNotch_versus_wtNotch.phenotype_absentNotch_versus_wtNotch.cls #absentNotch_versus_wtNotch_repos |
| Phenotype | phenotype_absentNotch_versus_wtNotch.cls#absentNotch_versus_wtNotch_repos |
| Upregulated in class | wtNotch |
| GeneSet | TCYTOTOXICPATHWAY |
| Enrichment Score (ES) | -0.906585 |
| Normalized Enrichment Score (NES) | -1.5732466 |
| Nominal p-value | 0.014553014 |
| FDR q-value | 0.43379834 |
| FWER p-Value | 1.0 |
| PROBE | DESCRIPTION (from dataset) | GENE SYMBOL | GENE_TITLE | RANK IN GENE LIST | RANK METRIC SCORE | RUNNING ES | CORE ENRICHMENT | |
|---|---|---|---|---|---|---|---|---|
| 1 | CD28 | 1400739 4210093 | 1442 | 0.195 | -0.0603 | No | ||
| 2 | PTPRC | 130402 5290148 | 2453 | 0.091 | -0.1065 | No | ||
| 3 | THY1 | 5910162 | 4874 | 0.019 | -0.2349 | No | ||
| 4 | CD3E | 3800056 | 16914 | -0.148 | -0.8690 | No | ||
| 5 | ITGAL | 1450324 | 17054 | -0.163 | -0.8621 | No | ||
| 6 | ITGB2 | 6380348 | 17883 | -0.340 | -0.8766 | Yes | ||
| 7 | CD2 | 430672 | 18239 | -0.522 | -0.8497 | Yes | ||
| 8 | CD3G | 2680288 | 18293 | -0.577 | -0.8017 | Yes | ||
| 9 | CD3D | 2810739 | 18351 | -0.648 | -0.7476 | Yes | ||
| 10 | ICAM1 | 6980138 | 18523 | -1.266 | -0.6452 | Yes | ||
| 11 | TRB@ | 3940292 | 18616 | -7.377 | -0.0000 | Yes |

