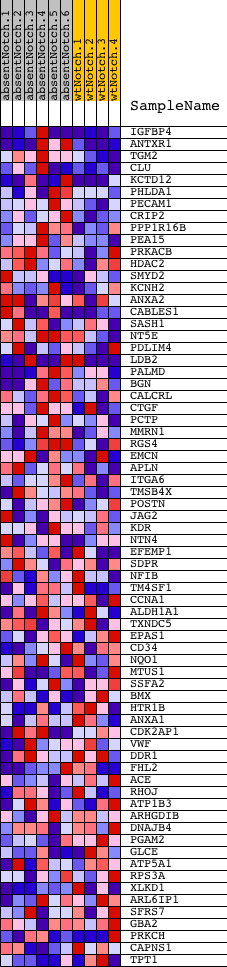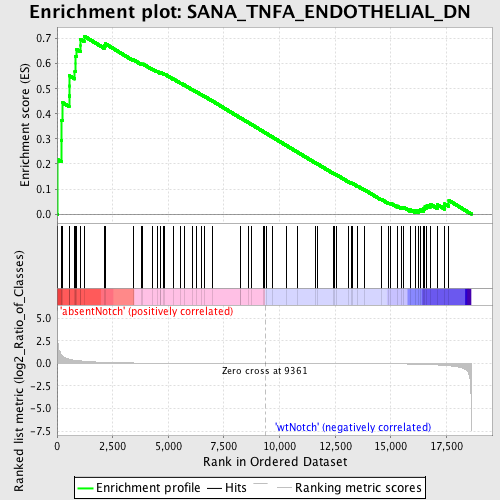
Profile of the Running ES Score & Positions of GeneSet Members on the Rank Ordered List
| Dataset | Set_03_absentNotch_versus_wtNotch.phenotype_absentNotch_versus_wtNotch.cls #absentNotch_versus_wtNotch.phenotype_absentNotch_versus_wtNotch.cls #absentNotch_versus_wtNotch_repos |
| Phenotype | phenotype_absentNotch_versus_wtNotch.cls#absentNotch_versus_wtNotch_repos |
| Upregulated in class | absentNotch |
| GeneSet | SANA_TNFA_ENDOTHELIAL_DN |
| Enrichment Score (ES) | 0.7099826 |
| Normalized Enrichment Score (NES) | 1.5790578 |
| Nominal p-value | 0.0056179776 |
| FDR q-value | 0.33604637 |
| FWER p-Value | 0.991 |
| PROBE | DESCRIPTION (from dataset) | GENE SYMBOL | GENE_TITLE | RANK IN GENE LIST | RANK METRIC SCORE | RUNNING ES | CORE ENRICHMENT | |
|---|---|---|---|---|---|---|---|---|
| 1 | IGFBP4 | 2680309 5420441 | 31 | 2.383 | 0.2165 | Yes | ||
| 2 | ANTXR1 | 1990593 2850056 | 193 | 0.925 | 0.2924 | Yes | ||
| 3 | TGM2 | 5360452 | 207 | 0.897 | 0.3739 | Yes | ||
| 4 | CLU | 5420075 | 255 | 0.792 | 0.4439 | Yes | ||
| 5 | KCTD12 | 7050091 | 540 | 0.468 | 0.4713 | Yes | ||
| 6 | PHLDA1 | 2450020 | 563 | 0.446 | 0.5110 | Yes | ||
| 7 | PECAM1 | 4810139 | 566 | 0.443 | 0.5515 | Yes | ||
| 8 | CRIP2 | 1050750 | 801 | 0.341 | 0.5700 | Yes | ||
| 9 | PPP1R16B | 3520300 | 827 | 0.333 | 0.5992 | Yes | ||
| 10 | PEA15 | 4590685 | 828 | 0.332 | 0.6296 | Yes | ||
| 11 | PRKACB | 4210170 | 882 | 0.318 | 0.6559 | Yes | ||
| 12 | HDAC2 | 4050433 | 1050 | 0.273 | 0.6719 | Yes | ||
| 13 | SMYD2 | 5050026 | 1053 | 0.273 | 0.6967 | Yes | ||
| 14 | KCNH2 | 1170451 | 1214 | 0.239 | 0.7100 | Yes | ||
| 15 | ANXA2 | 3140402 | 2115 | 0.116 | 0.6721 | No | ||
| 16 | CABLES1 | 610253 2190504 | 2157 | 0.112 | 0.6802 | No | ||
| 17 | SASH1 | 4070270 | 3433 | 0.044 | 0.6155 | No | ||
| 18 | NT5E | 2030603 1400731 | 3811 | 0.035 | 0.5983 | No | ||
| 19 | PDLIM4 | 3990358 | 3859 | 0.033 | 0.5988 | No | ||
| 20 | LDB2 | 5670441 6110170 | 4290 | 0.026 | 0.5780 | No | ||
| 21 | PALMD | 2900369 | 4498 | 0.023 | 0.5690 | No | ||
| 22 | BGN | 4730176 | 4664 | 0.021 | 0.5620 | No | ||
| 23 | CALCRL | 4280035 | 4666 | 0.021 | 0.5639 | No | ||
| 24 | CTGF | 4540577 | 4767 | 0.020 | 0.5603 | No | ||
| 25 | PCTP | 6980324 | 4833 | 0.019 | 0.5586 | No | ||
| 26 | MMRN1 | 7050278 | 5222 | 0.016 | 0.5391 | No | ||
| 27 | RGS4 | 2970711 | 5562 | 0.014 | 0.5221 | No | ||
| 28 | EMCN | 5130672 | 5708 | 0.013 | 0.5154 | No | ||
| 29 | APLN | 6620632 | 6087 | 0.011 | 0.4960 | No | ||
| 30 | ITGA6 | 3830129 | 6257 | 0.010 | 0.4878 | No | ||
| 31 | TMSB4X | 6620114 | 6467 | 0.009 | 0.4773 | No | ||
| 32 | POSTN | 450411 6040451 | 6618 | 0.008 | 0.4700 | No | ||
| 33 | JAG2 | 1500341 | 6990 | 0.007 | 0.4506 | No | ||
| 34 | KDR | 3610286 | 8238 | 0.003 | 0.3837 | No | ||
| 35 | NTN4 | 6940398 | 8243 | 0.003 | 0.3837 | No | ||
| 36 | EFEMP1 | 5860324 | 8585 | 0.002 | 0.3655 | No | ||
| 37 | SDPR | 3360292 | 8752 | 0.002 | 0.3567 | No | ||
| 38 | NFIB | 460450 | 9290 | 0.000 | 0.3278 | No | ||
| 39 | TM4SF1 | 2570021 | 9306 | 0.000 | 0.3270 | No | ||
| 40 | CCNA1 | 6290113 | 9423 | -0.000 | 0.3207 | No | ||
| 41 | ALDH1A1 | 6520706 | 9678 | -0.001 | 0.3071 | No | ||
| 42 | TXNDC5 | 3060433 3450605 | 10298 | -0.002 | 0.2740 | No | ||
| 43 | EPAS1 | 5290156 | 10821 | -0.004 | 0.2462 | No | ||
| 44 | CD34 | 6650270 | 11628 | -0.007 | 0.2033 | No | ||
| 45 | NQO1 | 3450136 6840121 | 11696 | -0.007 | 0.2004 | No | ||
| 46 | MTUS1 | 780348 4920609 | 12437 | -0.010 | 0.1614 | No | ||
| 47 | SSFA2 | 3870133 | 12454 | -0.010 | 0.1614 | No | ||
| 48 | BMX | 50136 2940242 4540059 | 12572 | -0.011 | 0.1561 | No | ||
| 49 | HTR1B | 5340133 | 13105 | -0.014 | 0.1287 | No | ||
| 50 | ANXA1 | 2320053 | 13216 | -0.015 | 0.1241 | No | ||
| 51 | CDK2AP1 | 2340156 | 13292 | -0.015 | 0.1215 | No | ||
| 52 | VWF | 4670519 | 13513 | -0.017 | 0.1112 | No | ||
| 53 | DDR1 | 2060044 5220180 | 13820 | -0.020 | 0.0966 | No | ||
| 54 | FHL2 | 1400008 | 14559 | -0.031 | 0.0596 | No | ||
| 55 | ACE | 1780161 4920315 | 14915 | -0.038 | 0.0439 | No | ||
| 56 | RHOJ | 6660176 | 14990 | -0.040 | 0.0436 | No | ||
| 57 | ATP1B3 | 6040128 | 15285 | -0.049 | 0.0322 | No | ||
| 58 | ARHGDIB | 4730433 | 15492 | -0.056 | 0.0262 | No | ||
| 59 | DNAJB4 | 380195 2760372 3940735 | 15582 | -0.060 | 0.0269 | No | ||
| 60 | PGAM2 | 3610605 | 15878 | -0.073 | 0.0177 | No | ||
| 61 | GLCE | 4850040 | 16090 | -0.085 | 0.0140 | No | ||
| 62 | ATP5A1 | 1990722 | 16255 | -0.094 | 0.0138 | No | ||
| 63 | RPS3A | 2470086 | 16324 | -0.099 | 0.0192 | No | ||
| 64 | XLKD1 | 520441 | 16480 | -0.112 | 0.0210 | No | ||
| 65 | ARL6IP1 | 2260278 | 16535 | -0.115 | 0.0287 | No | ||
| 66 | SFRS7 | 2760408 | 16625 | -0.121 | 0.0350 | No | ||
| 67 | GBA2 | 2900372 | 16764 | -0.134 | 0.0398 | No | ||
| 68 | PRKCH | 5720079 | 17097 | -0.169 | 0.0374 | No | ||
| 69 | CAPNS1 | 3940113 | 17424 | -0.225 | 0.0404 | No | ||
| 70 | TPT1 | 3450035 | 17611 | -0.260 | 0.0542 | No |