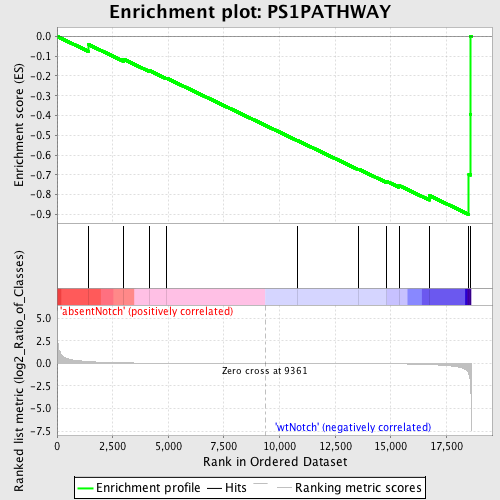
Profile of the Running ES Score & Positions of GeneSet Members on the Rank Ordered List
| Dataset | Set_03_absentNotch_versus_wtNotch.phenotype_absentNotch_versus_wtNotch.cls #absentNotch_versus_wtNotch.phenotype_absentNotch_versus_wtNotch.cls #absentNotch_versus_wtNotch_repos |
| Phenotype | phenotype_absentNotch_versus_wtNotch.cls#absentNotch_versus_wtNotch_repos |
| Upregulated in class | wtNotch |
| GeneSet | PS1PATHWAY |
| Enrichment Score (ES) | -0.90035874 |
| Normalized Enrichment Score (NES) | -1.5612943 |
| Nominal p-value | 0.00856531 |
| FDR q-value | 0.45170832 |
| FWER p-Value | 1.0 |
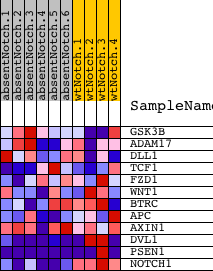
| PROBE | DESCRIPTION (from dataset) | GENE SYMBOL | GENE_TITLE | RANK IN GENE LIST | RANK METRIC SCORE | RUNNING ES | CORE ENRICHMENT | |
|---|---|---|---|---|---|---|---|---|
| 1 | GSK3B | 5360348 | 1401 | 0.203 | -0.0406 | No | ||
| 2 | ADAM17 | 360292 | 2989 | 0.061 | -0.1154 | No | ||
| 3 | DLL1 | 1770377 | 4165 | 0.028 | -0.1738 | No | ||
| 4 | TCF1 | 5390022 | 4921 | 0.018 | -0.2112 | No | ||
| 5 | FZD1 | 3140215 | 10800 | -0.004 | -0.5265 | No | ||
| 6 | WNT1 | 4780148 | 13567 | -0.018 | -0.6721 | No | ||
| 7 | BTRC | 3170131 | 14812 | -0.035 | -0.7330 | No | ||
| 8 | APC | 3850484 5860722 | 15367 | -0.052 | -0.7539 | No | ||
| 9 | AXIN1 | 3360358 6940451 | 16733 | -0.131 | -0.8050 | Yes | ||
| 10 | DVL1 | 5900450 6510162 | 18509 | -1.188 | -0.6976 | Yes | ||
| 11 | PSEN1 | 130403 2030647 6100603 | 18571 | -1.789 | -0.3954 | Yes | ||
| 12 | NOTCH1 | 3390114 | 18588 | -2.330 | 0.0015 | Yes |