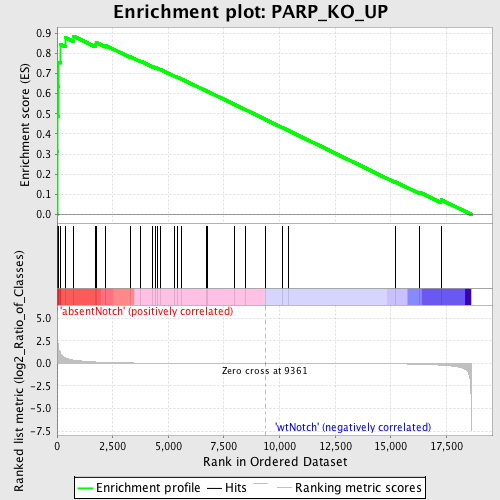
Profile of the Running ES Score & Positions of GeneSet Members on the Rank Ordered List
| Dataset | Set_03_absentNotch_versus_wtNotch.phenotype_absentNotch_versus_wtNotch.cls #absentNotch_versus_wtNotch.phenotype_absentNotch_versus_wtNotch.cls #absentNotch_versus_wtNotch_repos |
| Phenotype | phenotype_absentNotch_versus_wtNotch.cls#absentNotch_versus_wtNotch_repos |
| Upregulated in class | absentNotch |
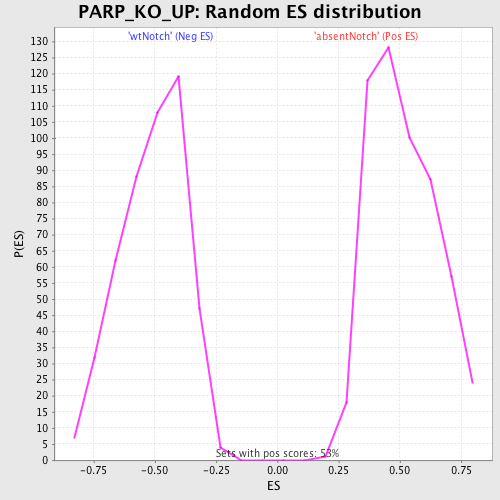
| GeneSet | PARP_KO_UP |
| Enrichment Score (ES) | 0.88613534 |
| Normalized Enrichment Score (NES) | 1.7175752 |
| Nominal p-value | 0.0 |
| FDR q-value | 0.2057831 |
| FWER p-Value | 0.163 |
| PROBE | DESCRIPTION (from dataset) | GENE SYMBOL | GENE_TITLE | RANK IN GENE LIST | RANK METRIC SCORE | RUNNING ES | CORE ENRICHMENT | |
|---|---|---|---|---|---|---|---|---|
| 1 | B2M | 5080332 5130059 | 4 | 4.233 | 0.3138 | Yes | ||
| 2 | IGFBP4 | 2680309 5420441 | 31 | 2.383 | 0.4892 | Yes | ||
| 3 | MDM2 | 3450053 5080138 | 44 | 2.014 | 0.6379 | Yes | ||
| 4 | CCND2 | 5340167 | 59 | 1.612 | 0.7567 | Yes | ||
| 5 | S100A6 | 1690204 | 139 | 1.247 | 0.8450 | Yes | ||
| 6 | ANXA3 | 5570494 | 373 | 0.619 | 0.8784 | Yes | ||
| 7 | APP | 2510053 | 734 | 0.366 | 0.8861 | Yes | ||
| 8 | PCNA | 940754 | 1719 | 0.156 | 0.8447 | No | ||
| 9 | CDKN1A | 4050088 6400706 | 1749 | 0.153 | 0.8545 | No | ||
| 10 | MGP | 6900736 | 2169 | 0.112 | 0.8402 | No | ||
| 11 | EEF2 | 1050369 4670035 5890598 | 3280 | 0.049 | 0.7842 | No | ||
| 12 | TIMP3 | 1450504 1980270 | 3764 | 0.036 | 0.7608 | No | ||
| 13 | ELN | 5080347 | 4307 | 0.026 | 0.7336 | No | ||
| 14 | CTTN | 780154 1690538 3310017 4060717 | 4441 | 0.024 | 0.7282 | No | ||
| 15 | CD81 | 5270093 | 4509 | 0.023 | 0.7263 | No | ||
| 16 | FST | 1110600 | 4630 | 0.022 | 0.7214 | No | ||
| 17 | MFAP5 | 4920139 | 5292 | 0.016 | 0.6870 | No | ||
| 18 | TINAGL1 | 1450273 | 5413 | 0.015 | 0.6817 | No | ||
| 19 | PRRX2 | 4260603 | 5596 | 0.013 | 0.6729 | No | ||
| 20 | AK1 | 130605 | 6729 | 0.008 | 0.6125 | No | ||
| 21 | CCNG1 | 870402 1500685 6110594 | 6772 | 0.008 | 0.6108 | No | ||
| 22 | IGFBP6 | 1580181 | 7970 | 0.004 | 0.5467 | No | ||
| 23 | CAV1 | 870025 | 8472 | 0.002 | 0.5199 | No | ||
| 24 | FGF7 | 5390484 | 9359 | 0.000 | 0.4723 | No | ||
| 25 | NOV | 2850746 | 10112 | -0.002 | 0.4320 | No | ||
| 26 | COL4A5 | 1340161 | 10380 | -0.003 | 0.4178 | No | ||
| 27 | GPX3 | 1340450 | 15196 | -0.046 | 0.1622 | No | ||
| 28 | DCN | 510332 5340026 5900711 6550092 | 16309 | -0.098 | 0.1096 | No | ||
| 29 | RANGAP1 | 2320593 6650601 | 17257 | -0.195 | 0.0731 | No |