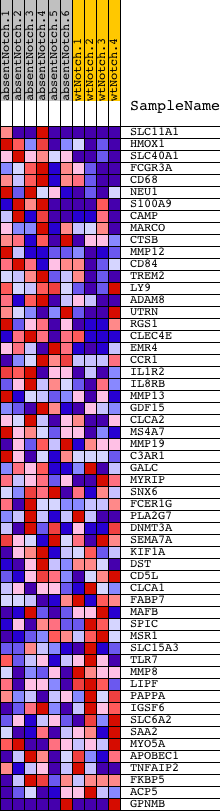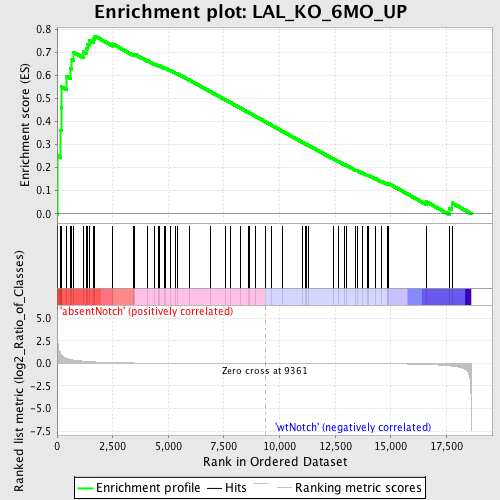
Profile of the Running ES Score & Positions of GeneSet Members on the Rank Ordered List
| Dataset | Set_03_absentNotch_versus_wtNotch.phenotype_absentNotch_versus_wtNotch.cls #absentNotch_versus_wtNotch.phenotype_absentNotch_versus_wtNotch.cls #absentNotch_versus_wtNotch_repos |
| Phenotype | phenotype_absentNotch_versus_wtNotch.cls#absentNotch_versus_wtNotch_repos |
| Upregulated in class | absentNotch |
| GeneSet | LAL_KO_6MO_UP |
| Enrichment Score (ES) | 0.7701219 |
| Normalized Enrichment Score (NES) | 1.6597751 |
| Nominal p-value | 0.0017730496 |
| FDR q-value | 0.16562223 |
| FWER p-Value | 0.598 |
| PROBE | DESCRIPTION (from dataset) | GENE SYMBOL | GENE_TITLE | RANK IN GENE LIST | RANK METRIC SCORE | RUNNING ES | CORE ENRICHMENT | |
|---|---|---|---|---|---|---|---|---|
| 1 | SLC11A1 | 940286 2810435 6370647 | 29 | 2.488 | 0.2512 | Yes | ||
| 2 | HMOX1 | 1740687 | 152 | 1.161 | 0.3626 | Yes | ||
| 3 | SLC40A1 | 2370286 | 183 | 0.970 | 0.4595 | Yes | ||
| 4 | FCGR3A | 3840184 | 203 | 0.903 | 0.5502 | Yes | ||
| 5 | CD68 | 6350450 | 427 | 0.565 | 0.5955 | Yes | ||
| 6 | NEU1 | 380546 | 593 | 0.432 | 0.6305 | Yes | ||
| 7 | S100A9 | 7050528 | 665 | 0.398 | 0.6671 | Yes | ||
| 8 | CAMP | 6290735 | 751 | 0.360 | 0.6991 | Yes | ||
| 9 | MARCO | 870056 | 1170 | 0.246 | 0.7016 | Yes | ||
| 10 | CTSB | 1400524 2360064 | 1305 | 0.222 | 0.7169 | Yes | ||
| 11 | MMP12 | 4920070 | 1356 | 0.213 | 0.7358 | Yes | ||
| 12 | CD84 | 1780168 | 1443 | 0.195 | 0.7510 | Yes | ||
| 13 | TREM2 | 6290358 | 1631 | 0.166 | 0.7578 | Yes | ||
| 14 | LY9 | 3360315 4070292 | 1701 | 0.157 | 0.7701 | Yes | ||
| 15 | ADAM8 | 450347 5670609 | 2501 | 0.088 | 0.7360 | No | ||
| 16 | UTRN | 3390048 | 3443 | 0.044 | 0.6898 | No | ||
| 17 | RGS1 | 4060347 4540181 | 3499 | 0.042 | 0.6911 | No | ||
| 18 | CLEC4E | 2940102 6550735 | 4073 | 0.030 | 0.6632 | No | ||
| 19 | EMR4 | 7040711 | 4391 | 0.025 | 0.6486 | No | ||
| 20 | CCR1 | 3440672 | 4547 | 0.023 | 0.6426 | No | ||
| 21 | IL1R2 | 1410600 | 4588 | 0.022 | 0.6427 | No | ||
| 22 | IL8RB | 450592 1170537 | 4813 | 0.019 | 0.6326 | No | ||
| 23 | MMP13 | 510471 3940097 | 4867 | 0.019 | 0.6316 | No | ||
| 24 | GDF15 | 4730017 | 5100 | 0.017 | 0.6208 | No | ||
| 25 | CLCA2 | 620521 | 5329 | 0.015 | 0.6101 | No | ||
| 26 | MS4A7 | 2260465 | 5429 | 0.014 | 0.6062 | No | ||
| 27 | MMP19 | 5080377 | 5932 | 0.011 | 0.5803 | No | ||
| 28 | C3AR1 | 5720131 | 6889 | 0.007 | 0.5296 | No | ||
| 29 | GALC | 2260685 4810161 6370040 | 7557 | 0.005 | 0.4941 | No | ||
| 30 | MYRIP | 1580471 | 7804 | 0.004 | 0.4813 | No | ||
| 31 | SNX6 | 6200086 | 8232 | 0.003 | 0.4586 | No | ||
| 32 | FCER1G | 5550020 | 8598 | 0.002 | 0.4391 | No | ||
| 33 | PLA2G7 | 4730092 | 8669 | 0.002 | 0.4355 | No | ||
| 34 | DNMT3A | 4050068 4810717 | 8894 | 0.001 | 0.4236 | No | ||
| 35 | SEMA7A | 2630239 5050593 | 9388 | -0.000 | 0.3970 | No | ||
| 36 | KIF1A | 450632 | 9625 | -0.001 | 0.3844 | No | ||
| 37 | DST | 430026 1090035 2340577 3170068 3870112 4780519 6400167 6450358 7040347 | 10116 | -0.002 | 0.3582 | No | ||
| 38 | CD5L | 4070605 | 11043 | -0.005 | 0.3088 | No | ||
| 39 | CLCA1 | 1400519 | 11178 | -0.005 | 0.3021 | No | ||
| 40 | FABP7 | 4590142 | 11217 | -0.005 | 0.3005 | No | ||
| 41 | MAFB | 1230471 | 11277 | -0.005 | 0.2979 | No | ||
| 42 | SPIC | 2060017 | 12412 | -0.010 | 0.2378 | No | ||
| 43 | MSR1 | 940538 | 12658 | -0.011 | 0.2257 | No | ||
| 44 | SLC15A3 | 6650333 | 12930 | -0.013 | 0.2124 | No | ||
| 45 | TLR7 | 3140300 | 13013 | -0.013 | 0.2094 | No | ||
| 46 | MMP8 | 7100064 | 13412 | -0.016 | 0.1896 | No | ||
| 47 | LIPF | 5050368 | 13485 | -0.017 | 0.1874 | No | ||
| 48 | PAPPA | 4230463 | 13716 | -0.019 | 0.1770 | No | ||
| 49 | IGSF6 | 5340348 | 13945 | -0.022 | 0.1669 | No | ||
| 50 | SLC6A2 | 1690605 2120750 6650722 | 13978 | -0.022 | 0.1674 | No | ||
| 51 | SAA2 | 1090139 | 14295 | -0.026 | 0.1531 | No | ||
| 52 | MYO5A | 2900288 5270333 | 14583 | -0.031 | 0.1408 | No | ||
| 53 | APOBEC1 | 4610022 | 14843 | -0.036 | 0.1305 | No | ||
| 54 | TNFAIP2 | 70438 1740215 | 14877 | -0.037 | 0.1325 | No | ||
| 55 | FKBP5 | 2190048 | 16604 | -0.120 | 0.0516 | No | ||
| 56 | ACP5 | 2230717 | 17622 | -0.262 | 0.0234 | No | ||
| 57 | GPNMB | 1780138 2340176 3390403 4560156 | 17749 | -0.297 | 0.0467 | No |