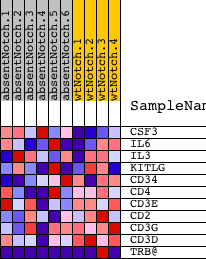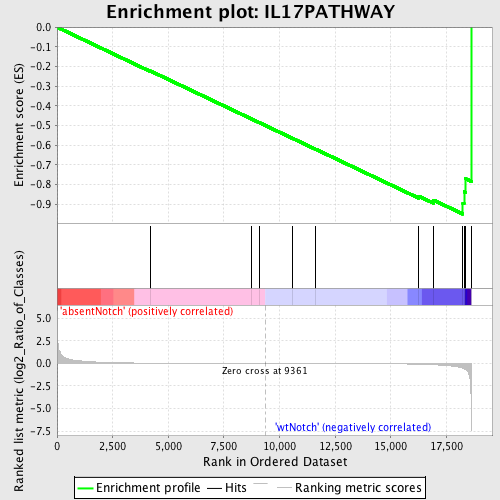
Profile of the Running ES Score & Positions of GeneSet Members on the Rank Ordered List
| Dataset | Set_03_absentNotch_versus_wtNotch.phenotype_absentNotch_versus_wtNotch.cls #absentNotch_versus_wtNotch.phenotype_absentNotch_versus_wtNotch.cls #absentNotch_versus_wtNotch_repos |
| Phenotype | phenotype_absentNotch_versus_wtNotch.cls#absentNotch_versus_wtNotch_repos |
| Upregulated in class | wtNotch |
| GeneSet | IL17PATHWAY |
| Enrichment Score (ES) | -0.94996905 |
| Normalized Enrichment Score (NES) | -1.6283448 |
| Nominal p-value | 0.0 |
| FDR q-value | 0.29628247 |
| FWER p-Value | 0.982 |
| PROBE | DESCRIPTION (from dataset) | GENE SYMBOL | GENE_TITLE | RANK IN GENE LIST | RANK METRIC SCORE | RUNNING ES | CORE ENRICHMENT | |
|---|---|---|---|---|---|---|---|---|
| 1 | CSF3 | 2230193 6660707 | 4194 | 0.027 | -0.2225 | No | ||
| 2 | IL6 | 380133 | 8741 | 0.002 | -0.4667 | No | ||
| 3 | IL3 | 2480280 | 9084 | 0.001 | -0.4850 | No | ||
| 4 | KITLG | 2120047 6220300 | 10583 | -0.003 | -0.5651 | No | ||
| 5 | CD34 | 6650270 | 11628 | -0.007 | -0.6205 | No | ||
| 6 | CD4 | 1090010 | 16262 | -0.094 | -0.8595 | No | ||
| 7 | CD3E | 3800056 | 16914 | -0.148 | -0.8788 | No | ||
| 8 | CD2 | 430672 | 18239 | -0.522 | -0.8945 | Yes | ||
| 9 | CD3G | 2680288 | 18293 | -0.577 | -0.8359 | Yes | ||
| 10 | CD3D | 2810739 | 18351 | -0.648 | -0.7701 | Yes | ||
| 11 | TRB@ | 3940292 | 18616 | -7.377 | -0.0000 | Yes |