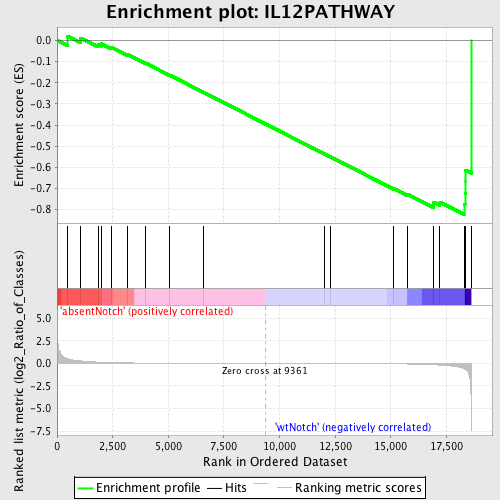
Profile of the Running ES Score & Positions of GeneSet Members on the Rank Ordered List
| Dataset | Set_03_absentNotch_versus_wtNotch.phenotype_absentNotch_versus_wtNotch.cls #absentNotch_versus_wtNotch.phenotype_absentNotch_versus_wtNotch.cls #absentNotch_versus_wtNotch_repos |
| Phenotype | phenotype_absentNotch_versus_wtNotch.cls#absentNotch_versus_wtNotch_repos |
| Upregulated in class | wtNotch |
| GeneSet | IL12PATHWAY |
| Enrichment Score (ES) | -0.822916 |
| Normalized Enrichment Score (NES) | -1.5751959 |
| Nominal p-value | 0.022727273 |
| FDR q-value | 0.4515389 |
| FWER p-Value | 1.0 |
| PROBE | DESCRIPTION (from dataset) | GENE SYMBOL | GENE_TITLE | RANK IN GENE LIST | RANK METRIC SCORE | RUNNING ES | CORE ENRICHMENT | |
|---|---|---|---|---|---|---|---|---|
| 1 | ETV5 | 110017 | 464 | 0.533 | 0.0203 | No | ||
| 2 | MAPK8 | 2640195 | 1063 | 0.270 | 0.0111 | No | ||
| 3 | MAP2K6 | 1230056 2940204 | 1841 | 0.142 | -0.0186 | No | ||
| 4 | CCR5 | 1980072 5910722 | 1990 | 0.126 | -0.0158 | No | ||
| 5 | MAPK14 | 5290731 | 2442 | 0.092 | -0.0322 | No | ||
| 6 | IL18 | 6180039 | 3156 | 0.054 | -0.0660 | No | ||
| 7 | JUN | 840170 | 3990 | 0.031 | -0.1082 | No | ||
| 8 | IL18R1 | 270546 | 5050 | 0.017 | -0.1636 | No | ||
| 9 | IFNG | 5670592 | 6573 | 0.008 | -0.2448 | No | ||
| 10 | IL12B | 460008 | 12024 | -0.008 | -0.5372 | No | ||
| 11 | JAK2 | 3780528 6100692 6550577 | 12283 | -0.009 | -0.5503 | No | ||
| 12 | IL12A | 7100551 | 15136 | -0.044 | -0.6999 | No | ||
| 13 | IL12RB2 | 6020465 | 15748 | -0.066 | -0.7271 | No | ||
| 14 | CD3E | 3800056 | 16914 | -0.148 | -0.7772 | Yes | ||
| 15 | STAT4 | 1660373 3130019 | 16918 | -0.148 | -0.7648 | Yes | ||
| 16 | IL12RB1 | 2230338 5420053 | 17208 | -0.185 | -0.7646 | Yes | ||
| 17 | CD3G | 2680288 | 18293 | -0.577 | -0.7738 | Yes | ||
| 18 | TYK2 | 1660465 1740736 | 18338 | -0.630 | -0.7226 | Yes | ||
| 19 | CXCR3 | 6590114 | 18349 | -0.647 | -0.6682 | Yes | ||
| 20 | CD3D | 2810739 | 18351 | -0.648 | -0.6131 | Yes | ||
| 21 | TRB@ | 3940292 | 18616 | -7.377 | -0.0000 | Yes |

