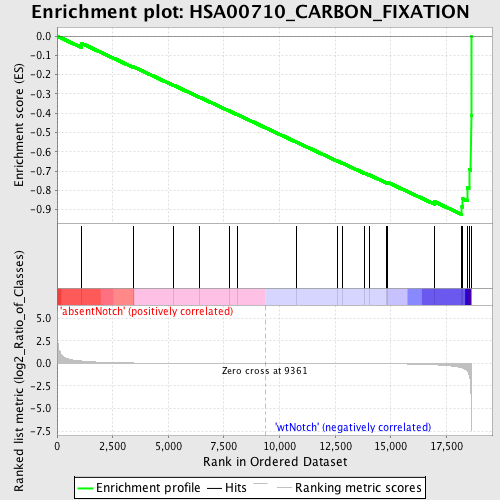
Profile of the Running ES Score & Positions of GeneSet Members on the Rank Ordered List
| Dataset | Set_03_absentNotch_versus_wtNotch.phenotype_absentNotch_versus_wtNotch.cls #absentNotch_versus_wtNotch.phenotype_absentNotch_versus_wtNotch.cls #absentNotch_versus_wtNotch_repos |
| Phenotype | phenotype_absentNotch_versus_wtNotch.cls#absentNotch_versus_wtNotch_repos |
| Upregulated in class | wtNotch |
| GeneSet | HSA00710_CARBON_FIXATION |
| Enrichment Score (ES) | -0.9251673 |
| Normalized Enrichment Score (NES) | -1.7575527 |
| Nominal p-value | 0.0 |
| FDR q-value | 0.0592897 |
| FWER p-Value | 0.196 |
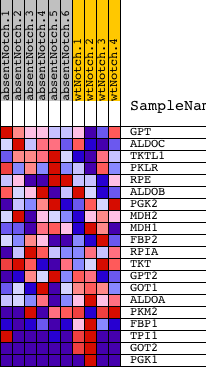
| PROBE | DESCRIPTION (from dataset) | GENE SYMBOL | GENE_TITLE | RANK IN GENE LIST | RANK METRIC SCORE | RUNNING ES | CORE ENRICHMENT | |
|---|---|---|---|---|---|---|---|---|
| 1 | GPT | 2350270 | 1101 | 0.261 | -0.0376 | No | ||
| 2 | ALDOC | 450121 610427 | 3427 | 0.044 | -0.1589 | No | ||
| 3 | TKTL1 | 2810672 6760102 | 5223 | 0.016 | -0.2541 | No | ||
| 4 | PKLR | 1170400 2470114 | 6390 | 0.009 | -0.3160 | No | ||
| 5 | RPE | 940114 | 7729 | 0.004 | -0.3876 | No | ||
| 6 | ALDOB | 4730324 | 8087 | 0.003 | -0.4065 | No | ||
| 7 | PGK2 | 2650091 | 10781 | -0.004 | -0.5510 | No | ||
| 8 | MDH2 | 1850601 | 12591 | -0.011 | -0.6474 | No | ||
| 9 | MDH1 | 6660358 6760731 | 12846 | -0.012 | -0.6601 | No | ||
| 10 | FBP2 | 1580193 | 13817 | -0.020 | -0.7105 | No | ||
| 11 | RPIA | 780079 | 14023 | -0.023 | -0.7197 | No | ||
| 12 | TKT | 6590064 6860039 | 14821 | -0.036 | -0.7596 | No | ||
| 13 | GPT2 | 1850463 | 14848 | -0.036 | -0.7580 | No | ||
| 14 | GOT1 | 2940465 | 16955 | -0.152 | -0.8585 | No | ||
| 15 | ALDOA | 6290672 | 18195 | -0.486 | -0.8848 | Yes | ||
| 16 | PKM2 | 6520403 70500 | 18229 | -0.514 | -0.8439 | Yes | ||
| 17 | FBP1 | 1470762 | 18434 | -0.818 | -0.7869 | Yes | ||
| 18 | TPI1 | 1500215 2100154 | 18514 | -1.197 | -0.6918 | Yes | ||
| 19 | GOT2 | 4570164 5220450 | 18603 | -3.412 | -0.4132 | Yes | ||
| 20 | PGK1 | 1570494 630300 | 18612 | -4.983 | 0.0002 | Yes |