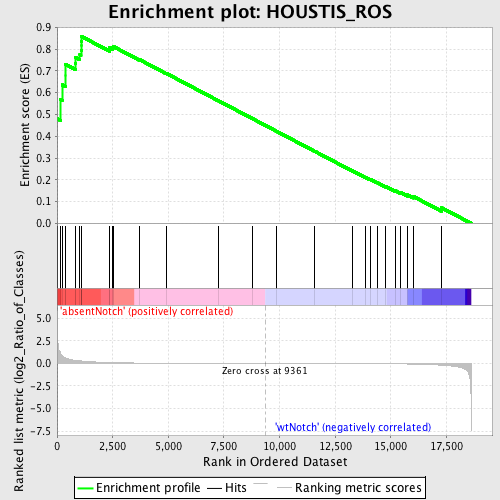
Profile of the Running ES Score & Positions of GeneSet Members on the Rank Ordered List
| Dataset | Set_03_absentNotch_versus_wtNotch.phenotype_absentNotch_versus_wtNotch.cls #absentNotch_versus_wtNotch.phenotype_absentNotch_versus_wtNotch.cls #absentNotch_versus_wtNotch_repos |
| Phenotype | phenotype_absentNotch_versus_wtNotch.cls#absentNotch_versus_wtNotch_repos |
| Upregulated in class | absentNotch |
| GeneSet | HOUSTIS_ROS |
| Enrichment Score (ES) | 0.8577281 |
| Normalized Enrichment Score (NES) | 1.6987077 |
| Nominal p-value | 0.0 |
| FDR q-value | 0.1705753 |
| FWER p-Value | 0.256 |
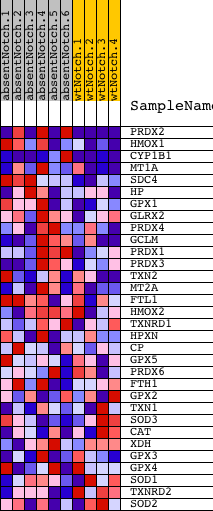
| PROBE | DESCRIPTION (from dataset) | GENE SYMBOL | GENE_TITLE | RANK IN GENE LIST | RANK METRIC SCORE | RUNNING ES | CORE ENRICHMENT | |
|---|---|---|---|---|---|---|---|---|
| 1 | PRDX2 | 6760095 4010619 5340577 | 0 | 5.791 | 0.4812 | Yes | ||
| 2 | HMOX1 | 1740687 | 152 | 1.161 | 0.5695 | Yes | ||
| 3 | CYP1B1 | 4760735 | 229 | 0.849 | 0.6360 | Yes | ||
| 4 | MT1A | 4850164 | 374 | 0.619 | 0.6797 | Yes | ||
| 5 | SDC4 | 6370411 | 375 | 0.616 | 0.7308 | Yes | ||
| 6 | HP | 2940551 6350068 | 823 | 0.334 | 0.7345 | Yes | ||
| 7 | GPX1 | 4150093 | 837 | 0.331 | 0.7613 | Yes | ||
| 8 | GLRX2 | 940433 | 1023 | 0.278 | 0.7745 | Yes | ||
| 9 | PRDX4 | 3800039 | 1074 | 0.267 | 0.7939 | Yes | ||
| 10 | GCLM | 4230270 | 1087 | 0.262 | 0.8151 | Yes | ||
| 11 | PRDX1 | 5720253 | 1090 | 0.262 | 0.8368 | Yes | ||
| 12 | PRDX3 | 1690035 | 1103 | 0.260 | 0.8577 | Yes | ||
| 13 | TXN2 | 2030402 | 2356 | 0.097 | 0.7984 | No | ||
| 14 | MT2A | 6860286 | 2357 | 0.097 | 0.8065 | No | ||
| 15 | FTL1 | 5670594 | 2500 | 0.088 | 0.8062 | No | ||
| 16 | HMOX2 | 6100193 | 2526 | 0.086 | 0.8120 | No | ||
| 17 | TXNRD1 | 6590446 | 3713 | 0.037 | 0.7513 | No | ||
| 18 | HPXN | 3440114 | 4929 | 0.018 | 0.6874 | No | ||
| 19 | CP | 2570484 | 7255 | 0.006 | 0.5628 | No | ||
| 20 | GPX5 | 4200397 5690739 | 8780 | 0.001 | 0.4809 | No | ||
| 21 | PRDX6 | 4920397 6380601 | 9880 | -0.001 | 0.4219 | No | ||
| 22 | FTH1 | 3830154 | 11564 | -0.006 | 0.3319 | No | ||
| 23 | GPX2 | 6940619 | 13261 | -0.015 | 0.2419 | No | ||
| 24 | TXN1 | 1850181 2260041 | 13882 | -0.021 | 0.2103 | No | ||
| 25 | SOD3 | 1410484 | 14083 | -0.023 | 0.2014 | No | ||
| 26 | CAT | 4280152 | 14384 | -0.028 | 0.1876 | No | ||
| 27 | XDH | 6840446 | 14772 | -0.035 | 0.1697 | No | ||
| 28 | GPX3 | 1340450 | 15196 | -0.046 | 0.1507 | No | ||
| 29 | GPX4 | 5080433 | 15428 | -0.054 | 0.1427 | No | ||
| 30 | SOD1 | 5890070 | 15752 | -0.067 | 0.1309 | No | ||
| 31 | TXNRD2 | 2510398 3780451 | 16021 | -0.081 | 0.1232 | No | ||
| 32 | SOD2 | 1410053 | 17270 | -0.197 | 0.0724 | No |