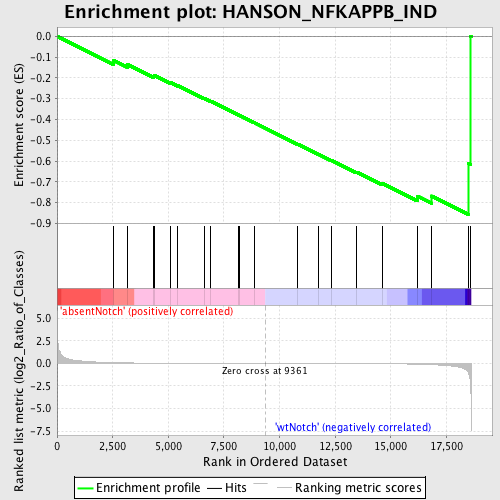
Profile of the Running ES Score & Positions of GeneSet Members on the Rank Ordered List
| Dataset | Set_03_absentNotch_versus_wtNotch.phenotype_absentNotch_versus_wtNotch.cls #absentNotch_versus_wtNotch.phenotype_absentNotch_versus_wtNotch.cls #absentNotch_versus_wtNotch_repos |
| Phenotype | phenotype_absentNotch_versus_wtNotch.cls#absentNotch_versus_wtNotch_repos |
| Upregulated in class | wtNotch |
| GeneSet | HANSON_NFKAPPB_IND |
| Enrichment Score (ES) | -0.8573952 |
| Normalized Enrichment Score (NES) | -1.6280347 |
| Nominal p-value | 0.004255319 |
| FDR q-value | 0.27053523 |
| FWER p-Value | 0.982 |
| PROBE | DESCRIPTION (from dataset) | GENE SYMBOL | GENE_TITLE | RANK IN GENE LIST | RANK METRIC SCORE | RUNNING ES | CORE ENRICHMENT | |
|---|---|---|---|---|---|---|---|---|
| 1 | SELPL | 1770167 | 2542 | 0.085 | -0.1154 | No | ||
| 2 | COL18A1 | 610301 4570338 | 3168 | 0.053 | -0.1357 | No | ||
| 3 | ADRA2C | 5130154 | 4335 | 0.025 | -0.1920 | No | ||
| 4 | CLCF1 | 4920176 6550750 | 4383 | 0.025 | -0.1884 | No | ||
| 5 | SOX5 | 2370576 2900167 3190128 5050528 | 5108 | 0.017 | -0.2231 | No | ||
| 6 | TMOD2 | 5130180 | 5432 | 0.014 | -0.2368 | No | ||
| 7 | CRISP1 | 50181 | 6604 | 0.008 | -0.2977 | No | ||
| 8 | ALDH1A3 | 2100270 | 6900 | 0.007 | -0.3118 | No | ||
| 9 | OAS1H | 3360722 | 8159 | 0.003 | -0.3786 | No | ||
| 10 | PKP1 | 1500433 | 8207 | 0.003 | -0.3804 | No | ||
| 11 | TSLP | 730408 1990500 | 8875 | 0.001 | -0.4159 | No | ||
| 12 | LGALS7 | 630148 | 10796 | -0.004 | -0.5182 | No | ||
| 13 | OLFR1508 | 1450463 | 11756 | -0.007 | -0.5680 | No | ||
| 14 | NPPB | 4150722 | 12322 | -0.009 | -0.5960 | No | ||
| 15 | CGREF1 | 4540546 | 13459 | -0.017 | -0.6529 | No | ||
| 16 | STK10 | 2760010 3940605 | 14618 | -0.032 | -0.7072 | No | ||
| 17 | SERPINB2 | 70487 | 16194 | -0.090 | -0.7692 | Yes | ||
| 18 | PIP5K1B | 3450113 6380278 | 16824 | -0.138 | -0.7683 | Yes | ||
| 19 | KLF3 | 5130438 | 18481 | -0.984 | -0.6104 | Yes | ||
| 20 | SH3RF1 | 1190463 2450594 6020026 | 18590 | -2.461 | 0.0014 | Yes |

