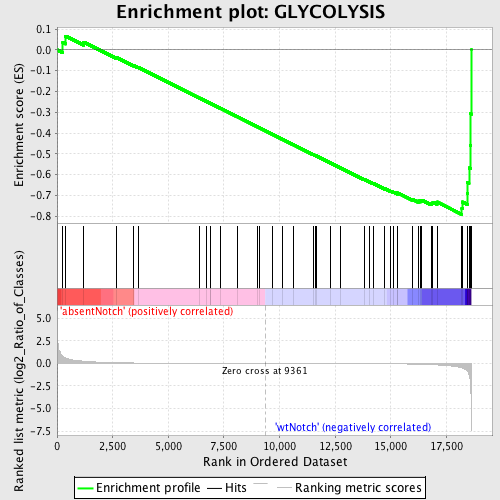
Profile of the Running ES Score & Positions of GeneSet Members on the Rank Ordered List
| Dataset | Set_03_absentNotch_versus_wtNotch.phenotype_absentNotch_versus_wtNotch.cls #absentNotch_versus_wtNotch.phenotype_absentNotch_versus_wtNotch.cls #absentNotch_versus_wtNotch_repos |
| Phenotype | phenotype_absentNotch_versus_wtNotch.cls#absentNotch_versus_wtNotch_repos |
| Upregulated in class | wtNotch |
| GeneSet | GLYCOLYSIS |
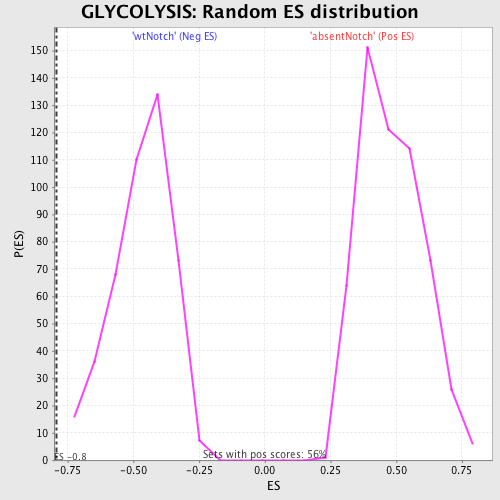
| Enrichment Score (ES) | -0.79175544 |
| Normalized Enrichment Score (NES) | -1.6970717 |
| Nominal p-value | 0.0 |
| FDR q-value | 0.1100275 |
| FWER p-Value | 0.629 |
| PROBE | DESCRIPTION (from dataset) | GENE SYMBOL | GENE_TITLE | RANK IN GENE LIST | RANK METRIC SCORE | RUNNING ES | CORE ENRICHMENT | |
|---|---|---|---|---|---|---|---|---|
| 1 | ALDH3B1 | 4210010 6940403 | 257 | 0.790 | 0.0351 | No | ||
| 2 | HK2 | 2640722 | 381 | 0.613 | 0.0665 | No | ||
| 3 | ADH1A | 3170427 | 1189 | 0.243 | 0.0381 | No | ||
| 4 | G6PC | 430093 | 2666 | 0.077 | -0.0366 | No | ||
| 5 | ALDOC | 450121 610427 | 3427 | 0.044 | -0.0748 | No | ||
| 6 | ALDH2 | 4230019 | 3635 | 0.038 | -0.0836 | No | ||
| 7 | PKLR | 1170400 2470114 | 6390 | 0.009 | -0.2313 | No | ||
| 8 | ACYP2 | 2510605 | 6711 | 0.008 | -0.2480 | No | ||
| 9 | ALDH9A1 | 4810047 | 6881 | 0.007 | -0.2567 | No | ||
| 10 | ALDH1A3 | 2100270 | 6900 | 0.007 | -0.2572 | No | ||
| 11 | PDHA2 | 2630438 | 7331 | 0.006 | -0.2800 | No | ||
| 12 | ALDOB | 4730324 | 8087 | 0.003 | -0.3205 | No | ||
| 13 | PDHB | 70215 610086 | 9006 | 0.001 | -0.3698 | No | ||
| 14 | PGM3 | 2570465 | 9113 | 0.001 | -0.3755 | No | ||
| 15 | ALDH1A1 | 6520706 | 9678 | -0.001 | -0.4058 | No | ||
| 16 | GCK | 2370273 | 10132 | -0.002 | -0.4301 | No | ||
| 17 | ACYP1 | 6380403 | 10629 | -0.003 | -0.4566 | No | ||
| 18 | ALDH1A2 | 2320301 | 11534 | -0.006 | -0.5049 | No | ||
| 19 | BPGM | 5080520 | 11595 | -0.007 | -0.5077 | No | ||
| 20 | PGM1 | 3840408 | 11642 | -0.007 | -0.5097 | No | ||
| 21 | ADH4 | 6840301 | 12290 | -0.009 | -0.5440 | No | ||
| 22 | ADHFE1 | 1990673 6840022 | 12743 | -0.012 | -0.5676 | No | ||
| 23 | FBP2 | 1580193 | 13817 | -0.020 | -0.6241 | No | ||
| 24 | ADH7 | 60465 | 14051 | -0.023 | -0.6353 | No | ||
| 25 | ENO2 | 2320068 | 14205 | -0.025 | -0.6420 | No | ||
| 26 | DLAT | 430452 | 14734 | -0.034 | -0.6683 | No | ||
| 27 | ENO1 | 5340128 | 14984 | -0.040 | -0.6792 | No | ||
| 28 | HK1 | 4280402 | 15118 | -0.043 | -0.6837 | No | ||
| 29 | PDHA1 | 5550397 | 15310 | -0.050 | -0.6909 | No | ||
| 30 | LDHC | 2030458 6100463 | 15315 | -0.050 | -0.6880 | No | ||
| 31 | GAPDH | 110022 430039 6220161 | 15980 | -0.078 | -0.7190 | No | ||
| 32 | DLD | 4150403 6590341 | 16231 | -0.092 | -0.7267 | No | ||
| 33 | HK3 | 3190288 6510142 | 16325 | -0.099 | -0.7256 | No | ||
| 34 | ALDH3A1 | 580095 | 16392 | -0.104 | -0.7227 | No | ||
| 35 | PFKM | 1990156 5720168 | 16826 | -0.138 | -0.7374 | No | ||
| 36 | LDHA | 2190594 | 16890 | -0.145 | -0.7318 | No | ||
| 37 | PGAM1 | 2570133 | 17077 | -0.165 | -0.7316 | No | ||
| 38 | ALDOA | 6290672 | 18195 | -0.486 | -0.7617 | Yes | ||
| 39 | PKM2 | 6520403 70500 | 18229 | -0.514 | -0.7316 | Yes | ||
| 40 | FBP1 | 1470762 | 18434 | -0.818 | -0.6918 | Yes | ||
| 41 | ENO3 | 5270136 | 18453 | -0.871 | -0.6388 | Yes | ||
| 42 | TPI1 | 1500215 2100154 | 18514 | -1.197 | -0.5678 | Yes | ||
| 43 | PFKP | 70138 6760040 1170278 | 18572 | -1.792 | -0.4598 | Yes | ||
| 44 | ALDH1B1 | 610195 | 18591 | -2.472 | -0.3076 | Yes | ||
| 45 | PGK1 | 1570494 630300 | 18612 | -4.983 | 0.0002 | Yes |