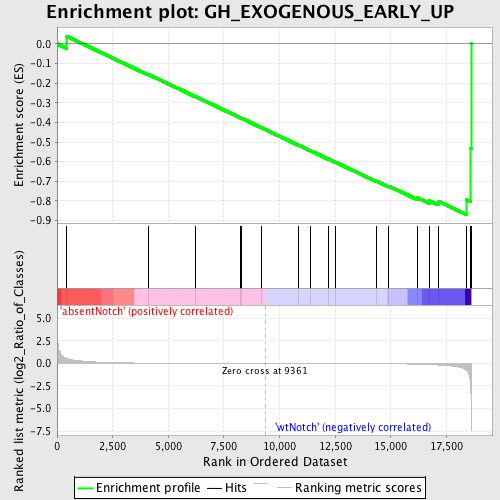
Profile of the Running ES Score & Positions of GeneSet Members on the Rank Ordered List
| Dataset | Set_03_absentNotch_versus_wtNotch.phenotype_absentNotch_versus_wtNotch.cls #absentNotch_versus_wtNotch.phenotype_absentNotch_versus_wtNotch.cls #absentNotch_versus_wtNotch_repos |
| Phenotype | phenotype_absentNotch_versus_wtNotch.cls#absentNotch_versus_wtNotch_repos |
| Upregulated in class | wtNotch |
| GeneSet | GH_EXOGENOUS_EARLY_UP |
| Enrichment Score (ES) | -0.8688751 |
| Normalized Enrichment Score (NES) | -1.589952 |
| Nominal p-value | 0.008333334 |
| FDR q-value | 0.45985785 |
| FWER p-Value | 1.0 |
| PROBE | DESCRIPTION (from dataset) | GENE SYMBOL | GENE_TITLE | RANK IN GENE LIST | RANK METRIC SCORE | RUNNING ES | CORE ENRICHMENT | |
|---|---|---|---|---|---|---|---|---|
| 1 | CXCR4 | 4590519 | 417 | 0.574 | 0.0391 | No | ||
| 2 | ARHGAP1 | 2810010 5270064 | 4087 | 0.029 | -0.1550 | No | ||
| 3 | FSHR | 610041 7040121 | 6227 | 0.010 | -0.2690 | No | ||
| 4 | COL12A1 | 1990025 3780086 | 8261 | 0.003 | -0.3780 | No | ||
| 5 | OMD | 6110044 | 8267 | 0.003 | -0.3779 | No | ||
| 6 | SCMH1 | 3190019 6770450 | 9194 | 0.000 | -0.4277 | No | ||
| 7 | RNASE2 | 3290563 | 10842 | -0.004 | -0.5158 | No | ||
| 8 | TECTA | 2570372 | 11384 | -0.006 | -0.5443 | No | ||
| 9 | INSM1 | 3450671 | 12178 | -0.009 | -0.5860 | No | ||
| 10 | CDC42EP3 | 2480138 | 12505 | -0.010 | -0.6024 | No | ||
| 11 | HIST1H3E | 840398 | 14373 | -0.027 | -0.6998 | No | ||
| 12 | PHF21A | 610014 | 14916 | -0.038 | -0.7249 | No | ||
| 13 | TNFRSF25 | 3710110 3850707 | 16203 | -0.091 | -0.7843 | No | ||
| 14 | NARG1 | 5910563 6350095 | 16732 | -0.131 | -0.7987 | No | ||
| 15 | IFIT2 | 4810735 | 17138 | -0.175 | -0.8018 | Yes | ||
| 16 | CDC42 | 1240168 3440278 4480519 5290162 | 18387 | -0.705 | -0.7934 | Yes | ||
| 17 | ADK | 380338 520180 5270524 | 18592 | -2.536 | -0.5326 | Yes | ||
| 18 | PGK1 | 1570494 630300 | 18612 | -4.983 | 0.0002 | Yes |

