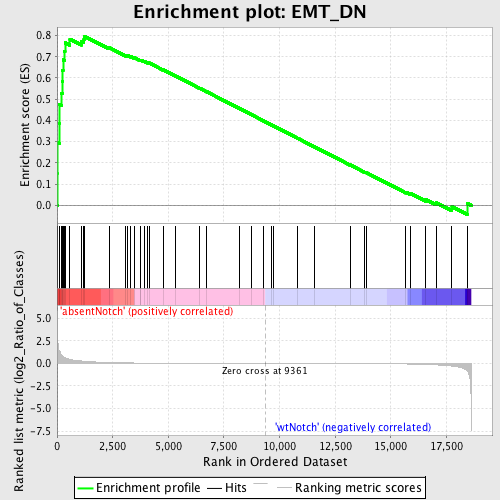
Profile of the Running ES Score & Positions of GeneSet Members on the Rank Ordered List
| Dataset | Set_03_absentNotch_versus_wtNotch.phenotype_absentNotch_versus_wtNotch.cls #absentNotch_versus_wtNotch.phenotype_absentNotch_versus_wtNotch.cls #absentNotch_versus_wtNotch_repos |
| Phenotype | phenotype_absentNotch_versus_wtNotch.cls#absentNotch_versus_wtNotch_repos |
| Upregulated in class | absentNotch |
| GeneSet | EMT_DN |
| Enrichment Score (ES) | 0.79707485 |
| Normalized Enrichment Score (NES) | 1.6799699 |
| Nominal p-value | 0.0 |
| FDR q-value | 0.14257888 |
| FWER p-Value | 0.383 |
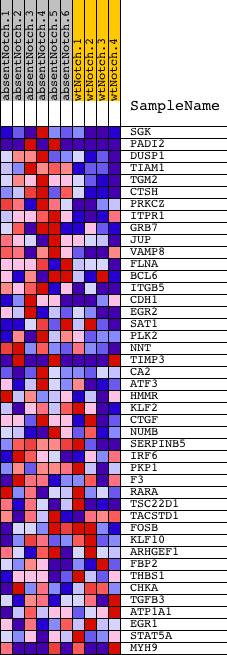
| PROBE | DESCRIPTION (from dataset) | GENE SYMBOL | GENE_TITLE | RANK IN GENE LIST | RANK METRIC SCORE | RUNNING ES | CORE ENRICHMENT | |
|---|---|---|---|---|---|---|---|---|
| 1 | SGK | 1400131 2480056 | 32 | 2.307 | 0.1499 | Yes | ||
| 2 | PADI2 | 2940092 6420136 | 37 | 2.221 | 0.2957 | Yes | ||
| 3 | DUSP1 | 6860121 | 96 | 1.398 | 0.3844 | Yes | ||
| 4 | TIAM1 | 5420288 | 104 | 1.369 | 0.4740 | Yes | ||
| 5 | TGM2 | 5360452 | 207 | 0.897 | 0.5275 | Yes | ||
| 6 | CTSH | 60524 | 231 | 0.848 | 0.5820 | Yes | ||
| 7 | PRKCZ | 3780279 | 242 | 0.830 | 0.6360 | Yes | ||
| 8 | ITPR1 | 3450519 | 269 | 0.768 | 0.6851 | Yes | ||
| 9 | GRB7 | 2100471 | 340 | 0.657 | 0.7245 | Yes | ||
| 10 | JUP | 2510671 | 356 | 0.638 | 0.7656 | Yes | ||
| 11 | VAMP8 | 380411 1190139 | 576 | 0.440 | 0.7828 | Yes | ||
| 12 | FLNA | 5390193 | 1092 | 0.262 | 0.7722 | Yes | ||
| 13 | BCL6 | 940100 | 1204 | 0.240 | 0.7820 | Yes | ||
| 14 | ITGB5 | 70129 | 1217 | 0.238 | 0.7971 | Yes | ||
| 15 | CDH1 | 1940736 | 2341 | 0.098 | 0.7431 | No | ||
| 16 | EGR2 | 3800403 | 3085 | 0.057 | 0.7068 | No | ||
| 17 | SAT1 | 4570463 | 3176 | 0.053 | 0.7054 | No | ||
| 18 | PLK2 | 6450152 | 3307 | 0.048 | 0.7016 | No | ||
| 19 | NNT | 540253 1170471 5550092 6760397 | 3465 | 0.043 | 0.6960 | No | ||
| 20 | TIMP3 | 1450504 1980270 | 3764 | 0.036 | 0.6823 | No | ||
| 21 | CA2 | 1660113 1660600 | 3767 | 0.036 | 0.6845 | No | ||
| 22 | ATF3 | 1940546 | 3907 | 0.032 | 0.6791 | No | ||
| 23 | HMMR | 5720315 6380168 | 4075 | 0.029 | 0.6721 | No | ||
| 24 | KLF2 | 6860270 | 4136 | 0.028 | 0.6707 | No | ||
| 25 | CTGF | 4540577 | 4767 | 0.020 | 0.6381 | No | ||
| 26 | NUMB | 2450735 3800253 6350040 | 5338 | 0.015 | 0.6084 | No | ||
| 27 | SERPINB5 | 6940050 | 6386 | 0.009 | 0.5527 | No | ||
| 28 | IRF6 | 840241 2640139 4050373 6840471 | 6736 | 0.008 | 0.5344 | No | ||
| 29 | PKP1 | 1500433 | 8207 | 0.003 | 0.4554 | No | ||
| 30 | F3 | 2940180 | 8719 | 0.002 | 0.4280 | No | ||
| 31 | RARA | 4050161 | 9286 | 0.000 | 0.3976 | No | ||
| 32 | TSC22D1 | 1340739 6040181 | 9653 | -0.001 | 0.3779 | No | ||
| 33 | TACSTD1 | 3780025 | 9719 | -0.001 | 0.3745 | No | ||
| 34 | FOSB | 1940142 | 10806 | -0.004 | 0.3162 | No | ||
| 35 | KLF10 | 4850056 | 11559 | -0.006 | 0.2762 | No | ||
| 36 | ARHGEF1 | 610347 4850603 6420672 | 13169 | -0.014 | 0.1905 | No | ||
| 37 | FBP2 | 1580193 | 13817 | -0.020 | 0.1570 | No | ||
| 38 | THBS1 | 4560494 430288 | 13904 | -0.021 | 0.1538 | No | ||
| 39 | CHKA | 510324 | 15681 | -0.064 | 0.0623 | No | ||
| 40 | TGFB3 | 1070041 | 15898 | -0.074 | 0.0555 | No | ||
| 41 | ATP1A1 | 5670451 | 16569 | -0.117 | 0.0272 | No | ||
| 42 | EGR1 | 4610347 | 17040 | -0.161 | 0.0125 | No | ||
| 43 | STAT5A | 2680458 | 17747 | -0.296 | -0.0061 | No | ||
| 44 | MYH9 | 3120091 4850292 | 18433 | -0.804 | 0.0099 | No |