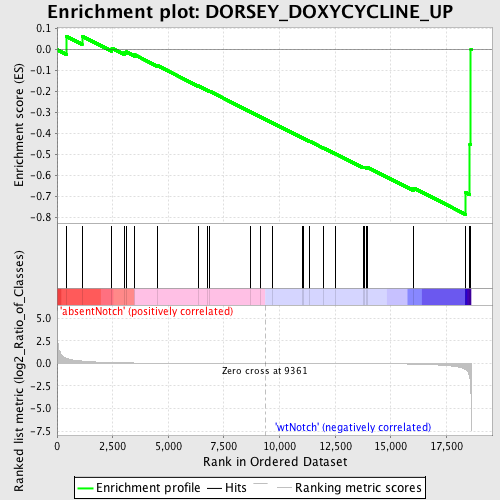
Profile of the Running ES Score & Positions of GeneSet Members on the Rank Ordered List
| Dataset | Set_03_absentNotch_versus_wtNotch.phenotype_absentNotch_versus_wtNotch.cls #absentNotch_versus_wtNotch.phenotype_absentNotch_versus_wtNotch.cls #absentNotch_versus_wtNotch_repos |
| Phenotype | phenotype_absentNotch_versus_wtNotch.cls#absentNotch_versus_wtNotch_repos |
| Upregulated in class | wtNotch |
| GeneSet | DORSEY_DOXYCYCLINE_UP |
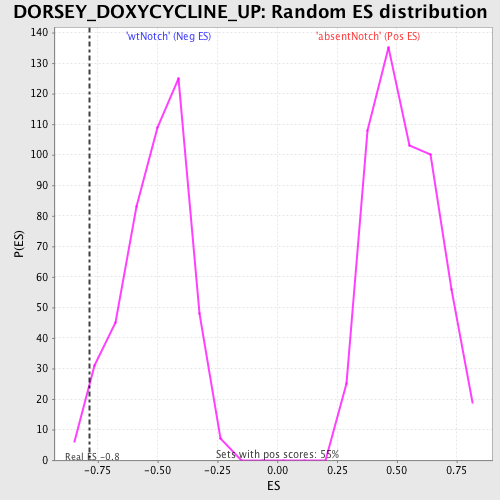
| Enrichment Score (ES) | -0.7866449 |
| Normalized Enrichment Score (NES) | -1.5535656 |
| Nominal p-value | 0.017621145 |
| FDR q-value | 0.4464194 |
| FWER p-Value | 1.0 |
| PROBE | DESCRIPTION (from dataset) | GENE SYMBOL | GENE_TITLE | RANK IN GENE LIST | RANK METRIC SCORE | RUNNING ES | CORE ENRICHMENT | |
|---|---|---|---|---|---|---|---|---|
| 1 | AKAP12 | 1450739 | 428 | 0.564 | 0.0628 | No | ||
| 2 | ATP1B1 | 3130594 | 1123 | 0.256 | 0.0644 | No | ||
| 3 | CCRL2 | 4760471 | 2466 | 0.090 | 0.0060 | No | ||
| 4 | GNG11 | 4010142 | 3034 | 0.059 | -0.0155 | No | ||
| 5 | ACVR1 | 6840671 | 3108 | 0.056 | -0.0109 | No | ||
| 6 | STC1 | 360161 | 3492 | 0.042 | -0.0251 | No | ||
| 7 | COL1A1 | 730020 | 4506 | 0.023 | -0.0760 | No | ||
| 8 | CD69 | 380167 4730088 | 6336 | 0.009 | -0.1730 | No | ||
| 9 | IL13RA2 | 2190577 | 6749 | 0.008 | -0.1940 | No | ||
| 10 | ARHGAP25 | 5080373 | 6857 | 0.007 | -0.1986 | No | ||
| 11 | PHLDA2 | 4810494 | 8685 | 0.002 | -0.2966 | No | ||
| 12 | TFPI2 | 3870324 | 9139 | 0.001 | -0.3209 | No | ||
| 13 | ITGA2B | 2680538 | 9687 | -0.001 | -0.3502 | No | ||
| 14 | SERPINE1 | 4210403 | 11015 | -0.005 | -0.4209 | No | ||
| 15 | SMAD7 | 430377 | 11084 | -0.005 | -0.4238 | No | ||
| 16 | SPARC | 1690086 | 11335 | -0.006 | -0.4364 | No | ||
| 17 | COL6A3 | 2640717 4070064 5390717 | 11970 | -0.008 | -0.4693 | No | ||
| 18 | ITGB3 | 5270463 | 12509 | -0.010 | -0.4967 | No | ||
| 19 | MT4 | 4780338 | 13763 | -0.020 | -0.5611 | No | ||
| 20 | GSN | 3830168 | 13813 | -0.020 | -0.5606 | No | ||
| 21 | THBS1 | 4560494 430288 | 13904 | -0.021 | -0.5623 | No | ||
| 22 | CD44 | 3990072 4850671 5860411 6860148 7050551 | 13970 | -0.022 | -0.5624 | No | ||
| 23 | TNFRSF9 | 2510400 6650484 | 16031 | -0.081 | -0.6609 | No | ||
| 24 | GRIK1 | 1500707 6020463 | 18370 | -0.683 | -0.6828 | Yes | ||
| 25 | PRSS1 | 5860044 | 18553 | -1.581 | -0.4522 | Yes | ||
| 26 | CRYAB | 4810619 | 18600 | -2.995 | 0.0009 | Yes |