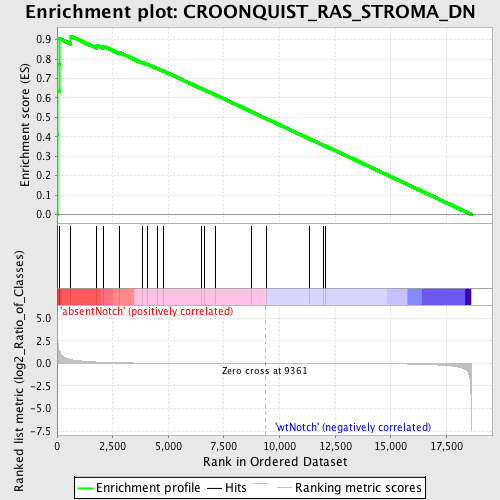
Profile of the Running ES Score & Positions of GeneSet Members on the Rank Ordered List
| Dataset | Set_03_absentNotch_versus_wtNotch.phenotype_absentNotch_versus_wtNotch.cls #absentNotch_versus_wtNotch.phenotype_absentNotch_versus_wtNotch.cls #absentNotch_versus_wtNotch_repos |
| Phenotype | phenotype_absentNotch_versus_wtNotch.cls#absentNotch_versus_wtNotch_repos |
| Upregulated in class | absentNotch |
| GeneSet | CROONQUIST_RAS_STROMA_DN |
| Enrichment Score (ES) | 0.91850895 |
| Normalized Enrichment Score (NES) | 1.6806237 |
| Nominal p-value | 0.0 |
| FDR q-value | 0.187408 |
| FWER p-Value | 0.379 |
| PROBE | DESCRIPTION (from dataset) | GENE SYMBOL | GENE_TITLE | RANK IN GENE LIST | RANK METRIC SCORE | RUNNING ES | CORE ENRICHMENT | |
|---|---|---|---|---|---|---|---|---|
| 1 | IGFBP7 | 520411 3060110 5290152 | 6 | 4.192 | 0.4140 | Yes | ||
| 2 | GJA1 | 5220731 | 34 | 2.268 | 0.6366 | Yes | ||
| 3 | DUSP1 | 6860121 | 96 | 1.398 | 0.7715 | Yes | ||
| 4 | TGFBI | 2060446 6900112 | 113 | 1.357 | 0.9048 | Yes | ||
| 5 | FSCN1 | 3450463 | 622 | 0.415 | 0.9185 | Yes | ||
| 6 | NR4A2 | 60273 | 1781 | 0.148 | 0.8709 | No | ||
| 7 | TPM2 | 520735 3870390 | 2100 | 0.117 | 0.8654 | No | ||
| 8 | COL1A2 | 380364 | 2818 | 0.069 | 0.8337 | No | ||
| 9 | NUPR1 | 1990524 | 3851 | 0.034 | 0.7815 | No | ||
| 10 | FOS | 1850315 | 4052 | 0.030 | 0.7737 | No | ||
| 11 | CD81 | 5270093 | 4509 | 0.023 | 0.7515 | No | ||
| 12 | CTGF | 4540577 | 4767 | 0.020 | 0.7396 | No | ||
| 13 | TMSB4X | 6620114 | 6467 | 0.009 | 0.6491 | No | ||
| 14 | POSTN | 450411 6040451 | 6618 | 0.008 | 0.6419 | No | ||
| 15 | ACTA2 | 60008 1230082 | 7126 | 0.006 | 0.6152 | No | ||
| 16 | IL6 | 380133 | 8741 | 0.002 | 0.5286 | No | ||
| 17 | IGFBP3 | 2370500 | 9391 | -0.000 | 0.4937 | No | ||
| 18 | SPARC | 1690086 | 11335 | -0.006 | 0.3898 | No | ||
| 19 | COL6A3 | 2640717 4070064 5390717 | 11970 | -0.008 | 0.3565 | No | ||
| 20 | SULF1 | 430575 | 12072 | -0.008 | 0.3519 | No |

