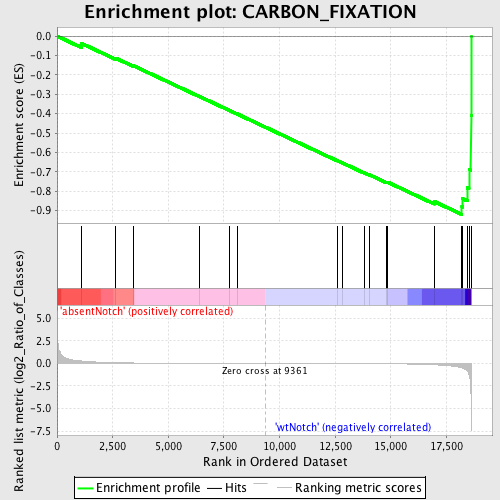
Profile of the Running ES Score & Positions of GeneSet Members on the Rank Ordered List
| Dataset | Set_03_absentNotch_versus_wtNotch.phenotype_absentNotch_versus_wtNotch.cls #absentNotch_versus_wtNotch.phenotype_absentNotch_versus_wtNotch.cls #absentNotch_versus_wtNotch_repos |
| Phenotype | phenotype_absentNotch_versus_wtNotch.cls#absentNotch_versus_wtNotch_repos |
| Upregulated in class | wtNotch |
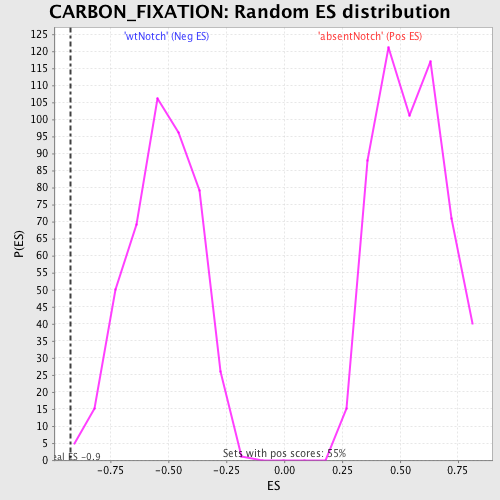
| GeneSet | CARBON_FIXATION |
| Enrichment Score (ES) | -0.92055136 |
| Normalized Enrichment Score (NES) | -1.7573365 |
| Nominal p-value | 0.0022371365 |
| FDR q-value | 0.044677928 |
| FWER p-Value | 0.197 |
| PROBE | DESCRIPTION (from dataset) | GENE SYMBOL | GENE_TITLE | RANK IN GENE LIST | RANK METRIC SCORE | RUNNING ES | CORE ENRICHMENT | |
|---|---|---|---|---|---|---|---|---|
| 1 | GPT | 2350270 | 1101 | 0.261 | -0.0377 | No | ||
| 2 | ME2 | 5080121 | 2641 | 0.079 | -0.1139 | No | ||
| 3 | ALDOC | 450121 610427 | 3427 | 0.044 | -0.1525 | No | ||
| 4 | PKLR | 1170400 2470114 | 6390 | 0.009 | -0.3110 | No | ||
| 5 | RPE | 940114 | 7729 | 0.004 | -0.3825 | No | ||
| 6 | ALDOB | 4730324 | 8087 | 0.003 | -0.4015 | No | ||
| 7 | MDH2 | 1850601 | 12591 | -0.011 | -0.6427 | No | ||
| 8 | MDH1 | 6660358 6760731 | 12846 | -0.012 | -0.6553 | No | ||
| 9 | FBP2 | 1580193 | 13817 | -0.020 | -0.7058 | No | ||
| 10 | RPIA | 780079 | 14023 | -0.023 | -0.7150 | No | ||
| 11 | TKT | 6590064 6860039 | 14821 | -0.036 | -0.7549 | No | ||
| 12 | GPT2 | 1850463 | 14848 | -0.036 | -0.7533 | No | ||
| 13 | GOT1 | 2940465 | 16955 | -0.152 | -0.8539 | No | ||
| 14 | ALDOA | 6290672 | 18195 | -0.486 | -0.8804 | Yes | ||
| 15 | PKM2 | 6520403 70500 | 18229 | -0.514 | -0.8397 | Yes | ||
| 16 | FBP1 | 1470762 | 18434 | -0.818 | -0.7831 | Yes | ||
| 17 | TPI1 | 1500215 2100154 | 18514 | -1.197 | -0.6884 | Yes | ||
| 18 | GOT2 | 4570164 5220450 | 18603 | -3.412 | -0.4111 | Yes | ||
| 19 | PGK1 | 1570494 630300 | 18612 | -4.983 | 0.0002 | Yes |