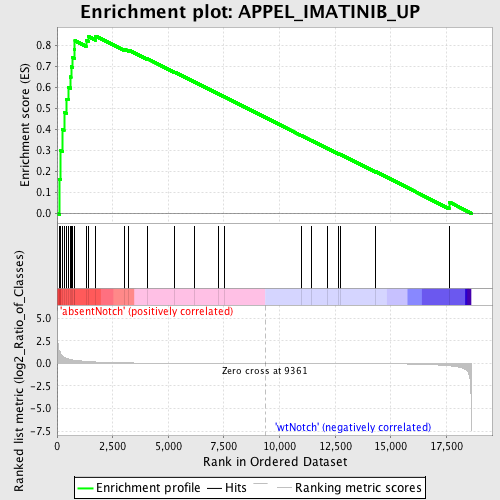
Profile of the Running ES Score & Positions of GeneSet Members on the Rank Ordered List
| Dataset | Set_03_absentNotch_versus_wtNotch.phenotype_absentNotch_versus_wtNotch.cls #absentNotch_versus_wtNotch.phenotype_absentNotch_versus_wtNotch.cls #absentNotch_versus_wtNotch_repos |
| Phenotype | phenotype_absentNotch_versus_wtNotch.cls#absentNotch_versus_wtNotch_repos |
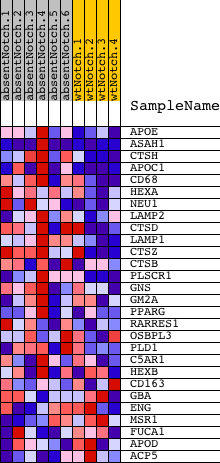
| Upregulated in class | absentNotch |
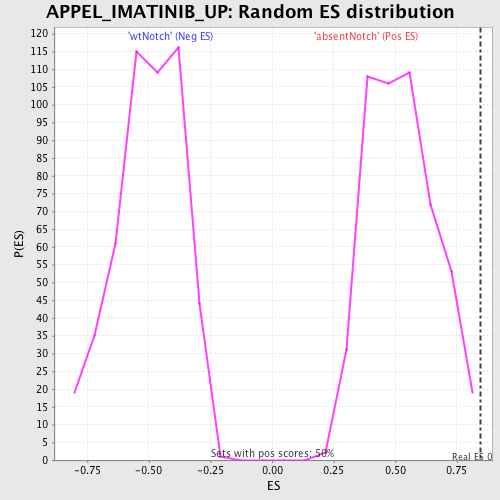
| GeneSet | APPEL_IMATINIB_UP |
| Enrichment Score (ES) | 0.8450861 |
| Normalized Enrichment Score (NES) | 1.6126548 |
| Nominal p-value | 0.0040 |
| FDR q-value | 0.24438536 |
| FWER p-Value | 0.915 |
| PROBE | DESCRIPTION (from dataset) | GENE SYMBOL | GENE_TITLE | RANK IN GENE LIST | RANK METRIC SCORE | RUNNING ES | CORE ENRICHMENT | |
|---|---|---|---|---|---|---|---|---|
| 1 | APOE | 4200671 | 110 | 1.361 | 0.1621 | Yes | ||
| 2 | ASAH1 | 510152 1340484 1740707 | 156 | 1.128 | 0.2989 | Yes | ||
| 3 | CTSH | 60524 | 231 | 0.848 | 0.3996 | Yes | ||
| 4 | APOC1 | 5900066 6220408 | 312 | 0.695 | 0.4811 | Yes | ||
| 5 | CD68 | 6350450 | 427 | 0.565 | 0.5446 | Yes | ||
| 6 | HEXA | 2630358 | 499 | 0.496 | 0.6020 | Yes | ||
| 7 | NEU1 | 380546 | 593 | 0.432 | 0.6504 | Yes | ||
| 8 | LAMP2 | 1230402 1980373 | 626 | 0.413 | 0.6997 | Yes | ||
| 9 | CTSD | 1070195 | 691 | 0.386 | 0.7438 | Yes | ||
| 10 | LAMP1 | 2470524 | 772 | 0.353 | 0.7831 | Yes | ||
| 11 | CTSZ | 1500687 1690364 | 802 | 0.341 | 0.8236 | Yes | ||
| 12 | CTSB | 1400524 2360064 | 1305 | 0.222 | 0.8239 | Yes | ||
| 13 | PLSCR1 | 2650301 | 1403 | 0.203 | 0.8437 | Yes | ||
| 14 | GNS | 3120458 | 1733 | 0.154 | 0.8451 | Yes | ||
| 15 | GM2A | 430095 | 3049 | 0.058 | 0.7815 | No | ||
| 16 | PPARG | 1990168 2680603 6130632 | 3229 | 0.051 | 0.7782 | No | ||
| 17 | RARRES1 | 770139 5860390 | 4064 | 0.030 | 0.7370 | No | ||
| 18 | OSBPL3 | 3170164 4210196 | 5278 | 0.016 | 0.6737 | No | ||
| 19 | PLD1 | 2450537 | 6172 | 0.010 | 0.6269 | No | ||
| 20 | C5AR1 | 4540402 | 7264 | 0.006 | 0.5689 | No | ||
| 21 | HEXB | 5860692 | 7532 | 0.005 | 0.5552 | No | ||
| 22 | CD163 | 2480315 | 10968 | -0.004 | 0.3710 | No | ||
| 23 | GBA | 2640301 | 11455 | -0.006 | 0.3456 | No | ||
| 24 | ENG | 4280270 | 12160 | -0.009 | 0.3088 | No | ||
| 25 | MSR1 | 940538 | 12658 | -0.011 | 0.2834 | No | ||
| 26 | FUCA1 | 610075 | 12726 | -0.011 | 0.2812 | No | ||
| 27 | APOD | 4920441 | 14314 | -0.026 | 0.1991 | No | ||
| 28 | ACP5 | 2230717 | 17622 | -0.262 | 0.0535 | No |