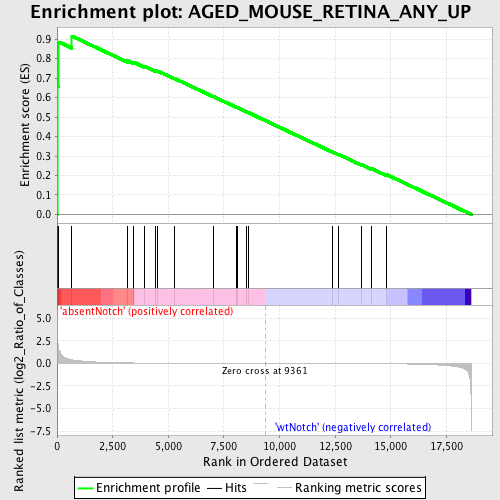
Profile of the Running ES Score & Positions of GeneSet Members on the Rank Ordered List
| Dataset | Set_03_absentNotch_versus_wtNotch.phenotype_absentNotch_versus_wtNotch.cls #absentNotch_versus_wtNotch.phenotype_absentNotch_versus_wtNotch.cls #absentNotch_versus_wtNotch_repos |
| Phenotype | phenotype_absentNotch_versus_wtNotch.cls#absentNotch_versus_wtNotch_repos |
| Upregulated in class | absentNotch |
| GeneSet | AGED_MOUSE_RETINA_ANY_UP |
| Enrichment Score (ES) | 0.9160318 |
| Normalized Enrichment Score (NES) | 1.6473509 |
| Nominal p-value | 0.0 |
| FDR q-value | 0.1683472 |
| FWER p-Value | 0.712 |
| PROBE | DESCRIPTION (from dataset) | GENE SYMBOL | GENE_TITLE | RANK IN GENE LIST | RANK METRIC SCORE | RUNNING ES | CORE ENRICHMENT | |
|---|---|---|---|---|---|---|---|---|
| 1 | B2M | 5080332 5130059 | 4 | 4.233 | 0.6612 | Yes | ||
| 2 | SLC38A2 | 1470242 3800026 | 81 | 1.464 | 0.8858 | Yes | ||
| 3 | RBM3 | 2360739 5700167 | 668 | 0.395 | 0.9160 | Yes | ||
| 4 | COL18A1 | 610301 4570338 | 3168 | 0.053 | 0.7899 | No | ||
| 5 | CEBPD | 3360176 | 3449 | 0.044 | 0.7817 | No | ||
| 6 | ATF3 | 1940546 | 3907 | 0.032 | 0.7622 | No | ||
| 7 | PTGDS | 3610519 | 4399 | 0.024 | 0.7396 | No | ||
| 8 | MLF1 | 4570722 | 4523 | 0.023 | 0.7365 | No | ||
| 9 | TSPAN5 | 6770019 | 5264 | 0.016 | 0.6992 | No | ||
| 10 | SMAD1 | 630537 1850333 | 7014 | 0.007 | 0.6062 | No | ||
| 11 | RGR | 730156 6400368 | 8062 | 0.003 | 0.5504 | No | ||
| 12 | ABCA1 | 6290156 | 8101 | 0.003 | 0.5489 | No | ||
| 13 | ENPP2 | 5860546 | 8492 | 0.002 | 0.5283 | No | ||
| 14 | TSG101 | 770148 | 8594 | 0.002 | 0.5232 | No | ||
| 15 | DHRS7 | 2970372 5290193 | 12366 | -0.010 | 0.3220 | No | ||
| 16 | SREBF1 | 4780333 | 12659 | -0.011 | 0.3080 | No | ||
| 17 | COL19A1 | 6220441 | 13680 | -0.019 | 0.2561 | No | ||
| 18 | ELL2 | 6420091 | 14145 | -0.024 | 0.2349 | No | ||
| 19 | HDC | 4150463 | 14783 | -0.035 | 0.2061 | No |

