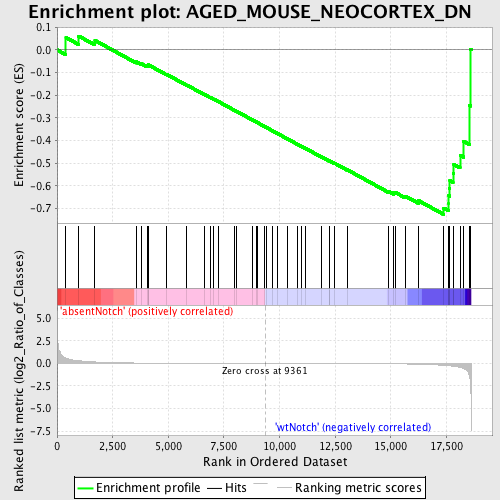
Profile of the Running ES Score & Positions of GeneSet Members on the Rank Ordered List
| Dataset | Set_03_absentNotch_versus_wtNotch.phenotype_absentNotch_versus_wtNotch.cls #absentNotch_versus_wtNotch.phenotype_absentNotch_versus_wtNotch.cls #absentNotch_versus_wtNotch_repos |
| Phenotype | phenotype_absentNotch_versus_wtNotch.cls#absentNotch_versus_wtNotch_repos |
| Upregulated in class | wtNotch |
| GeneSet | AGED_MOUSE_NEOCORTEX_DN |
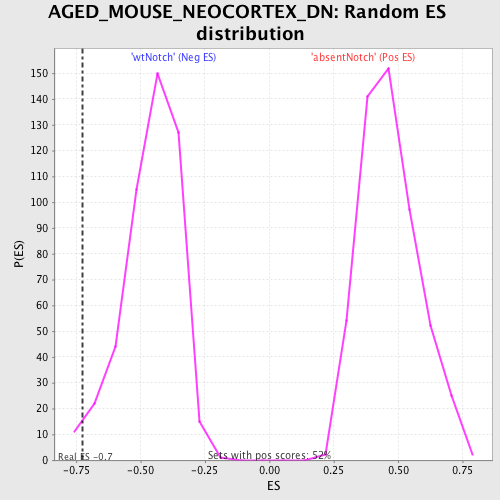
| Enrichment Score (ES) | -0.7257864 |
| Normalized Enrichment Score (NES) | -1.5842402 |
| Nominal p-value | 0.016842104 |
| FDR q-value | 0.4600659 |
| FWER p-Value | 1.0 |
| PROBE | DESCRIPTION (from dataset) | GENE SYMBOL | GENE_TITLE | RANK IN GENE LIST | RANK METRIC SCORE | RUNNING ES | CORE ENRICHMENT | |
|---|---|---|---|---|---|---|---|---|
| 1 | GSPT1 | 5420050 | 398 | 0.590 | 0.0544 | No | ||
| 2 | RAD52 | 110093 | 973 | 0.290 | 0.0607 | No | ||
| 3 | LY9 | 3360315 4070292 | 1701 | 0.157 | 0.0418 | No | ||
| 4 | NR2F1 | 4120528 360402 | 3553 | 0.041 | -0.0526 | No | ||
| 5 | UFD1L | 870020 | 3784 | 0.035 | -0.0605 | No | ||
| 6 | PRKDC | 1400072 4230541 | 4054 | 0.030 | -0.0711 | No | ||
| 7 | ACTC1 | 2340021 5220465 | 4095 | 0.029 | -0.0695 | No | ||
| 8 | NKX1-2 | 5720463 | 4096 | 0.029 | -0.0658 | No | ||
| 9 | MAP3K7 | 6040068 | 4923 | 0.018 | -0.1079 | No | ||
| 10 | NPY1R | 5890347 | 5831 | 0.012 | -0.1552 | No | ||
| 11 | RET | 3850746 | 6625 | 0.008 | -0.1969 | No | ||
| 12 | FRAP1 | 2850037 6660010 | 6904 | 0.007 | -0.2109 | No | ||
| 13 | MASP1 | 1780619 2900066 | 7041 | 0.007 | -0.2174 | No | ||
| 14 | CP | 2570484 | 7255 | 0.006 | -0.2281 | No | ||
| 15 | HTR4 | 4050093 4760446 | 7989 | 0.004 | -0.2671 | No | ||
| 16 | CCL1 | 4230167 | 8043 | 0.004 | -0.2695 | No | ||
| 17 | STRBP | 4210594 5360239 | 8796 | 0.001 | -0.3098 | No | ||
| 18 | WDFY3 | 3610041 4560333 4570273 | 8950 | 0.001 | -0.3179 | No | ||
| 19 | SEZ6 | 3450722 | 9003 | 0.001 | -0.3206 | No | ||
| 20 | GSTM3 | 2570451 | 9324 | 0.000 | -0.3378 | No | ||
| 21 | PAPOLA | 4200286 4850112 | 9396 | -0.000 | -0.3417 | No | ||
| 22 | REG3G | 1340520 | 9674 | -0.001 | -0.3565 | No | ||
| 23 | NEUROD4 | 1770273 | 9921 | -0.001 | -0.3695 | No | ||
| 24 | MPP1 | 670767 | 10352 | -0.003 | -0.3924 | No | ||
| 25 | GDNF | 4050487 5720739 | 10786 | -0.004 | -0.4152 | No | ||
| 26 | MTNR1A | 380204 | 11006 | -0.005 | -0.4264 | No | ||
| 27 | TRIM10 | 940451 3940593 | 11157 | -0.005 | -0.4338 | No | ||
| 28 | APOH | 6040309 | 11897 | -0.008 | -0.4726 | No | ||
| 29 | GLI3 | 5690148 | 12233 | -0.009 | -0.4895 | No | ||
| 30 | FGF11 | 840292 | 12253 | -0.009 | -0.4894 | No | ||
| 31 | FLNC | 2360048 5050270 | 12459 | -0.010 | -0.4991 | No | ||
| 32 | HOXC4 | 1940193 | 13037 | -0.014 | -0.5284 | No | ||
| 33 | PTPRR | 130121 3990273 | 14884 | -0.037 | -0.6231 | No | ||
| 34 | EEF1G | 3940603 | 15131 | -0.044 | -0.6307 | No | ||
| 35 | GPX3 | 1340450 | 15196 | -0.046 | -0.6283 | No | ||
| 36 | COL6A1 | 1410670 2940091 6510086 | 15656 | -0.063 | -0.6450 | No | ||
| 37 | MYLPF | 6110092 | 16248 | -0.093 | -0.6648 | No | ||
| 38 | CSTF2 | 6040463 | 17381 | -0.217 | -0.6980 | Yes | ||
| 39 | VRK3 | 7150743 | 17600 | -0.258 | -0.6765 | Yes | ||
| 40 | FEM1B | 1230110 | 17605 | -0.259 | -0.6435 | Yes | ||
| 41 | CKM | 1450524 | 17637 | -0.267 | -0.6109 | Yes | ||
| 42 | NEDD8 | 2350722 | 17654 | -0.271 | -0.5769 | Yes | ||
| 43 | CDC20 | 3440017 3440044 6220088 | 17797 | -0.312 | -0.5444 | Yes | ||
| 44 | NMB | 3360735 | 17832 | -0.321 | -0.5049 | Yes | ||
| 45 | ECM1 | 940068 5390309 | 18112 | -0.429 | -0.4649 | Yes | ||
| 46 | LTB | 3990672 | 18269 | -0.550 | -0.4026 | Yes | ||
| 47 | HSPA8 | 2120315 1050132 6550746 | 18532 | -1.334 | -0.2453 | Yes | ||
| 48 | MYL4 | 6860288 | 18577 | -1.944 | 0.0021 | Yes |