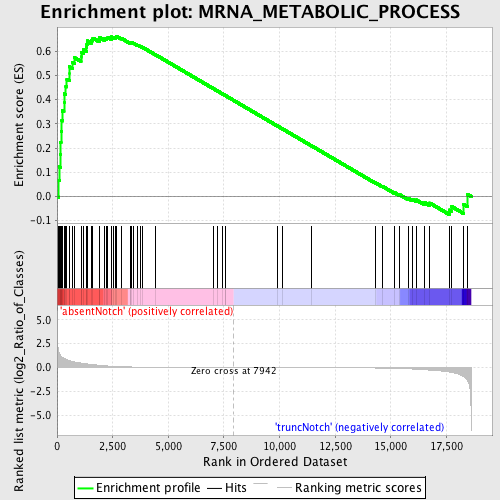
Profile of the Running ES Score & Positions of GeneSet Members on the Rank Ordered List
| Dataset | Set_03_absentNotch_versus_truncNotch.phenotype_absentNotch_versus_truncNotch.cls #absentNotch_versus_truncNotch.phenotype_absentNotch_versus_truncNotch.cls #absentNotch_versus_truncNotch_repos |
| Phenotype | phenotype_absentNotch_versus_truncNotch.cls#absentNotch_versus_truncNotch_repos |
| Upregulated in class | absentNotch |
| GeneSet | MRNA_METABOLIC_PROCESS |
| Enrichment Score (ES) | 0.6626004 |
| Normalized Enrichment Score (NES) | 1.5303487 |
| Nominal p-value | 0.0067114094 |
| FDR q-value | 0.3410388 |
| FWER p-Value | 0.994 |
| PROBE | DESCRIPTION (from dataset) | GENE SYMBOL | GENE_TITLE | RANK IN GENE LIST | RANK METRIC SCORE | RUNNING ES | CORE ENRICHMENT | |
|---|---|---|---|---|---|---|---|---|
| 1 | PABPC1 | 2650180 2690253 6020632 1990270 | 58 | 1.760 | 0.0672 | Yes | ||
| 2 | SFRS1 | 2360440 | 105 | 1.447 | 0.1226 | Yes | ||
| 3 | USP39 | 1090242 3520435 4760736 | 142 | 1.323 | 0.1735 | Yes | ||
| 4 | GSPT1 | 5420050 | 152 | 1.279 | 0.2242 | Yes | ||
| 5 | SFRS6 | 60224 | 177 | 1.185 | 0.2702 | Yes | ||
| 6 | DHX15 | 870632 | 212 | 1.110 | 0.3128 | Yes | ||
| 7 | SPOP | 450035 | 232 | 1.060 | 0.3541 | Yes | ||
| 8 | CSTF2 | 6040463 | 310 | 0.946 | 0.3877 | Yes | ||
| 9 | SFRS2IP | 730687 1500373 | 317 | 0.937 | 0.4249 | Yes | ||
| 10 | SFPQ | 4760110 | 394 | 0.850 | 0.4547 | Yes | ||
| 11 | SRPK2 | 6380341 | 440 | 0.812 | 0.4848 | Yes | ||
| 12 | DDX20 | 3290348 | 552 | 0.721 | 0.5076 | Yes | ||
| 13 | GRSF1 | 2100184 | 555 | 0.719 | 0.5362 | Yes | ||
| 14 | SF3A3 | 6660603 | 688 | 0.639 | 0.5547 | Yes | ||
| 15 | SRPK1 | 450110 | 777 | 0.596 | 0.5738 | Yes | ||
| 16 | CDC2L2 | 1400671 5290168 | 1075 | 0.470 | 0.5765 | Yes | ||
| 17 | UPF2 | 4810471 | 1080 | 0.467 | 0.5950 | Yes | ||
| 18 | PAIP1 | 3870576 | 1194 | 0.427 | 0.6059 | Yes | ||
| 19 | LSM3 | 780164 | 1317 | 0.383 | 0.6147 | Yes | ||
| 20 | DHX38 | 780243 | 1336 | 0.376 | 0.6287 | Yes | ||
| 21 | KHDRBS1 | 1240403 6040040 | 1351 | 0.373 | 0.6429 | Yes | ||
| 22 | KIN | 6550014 | 1531 | 0.329 | 0.6464 | Yes | ||
| 23 | EFTUD2 | 2470707 4610148 | 1607 | 0.303 | 0.6544 | Yes | ||
| 24 | SMG6 | 5820243 | 1896 | 0.234 | 0.6483 | Yes | ||
| 25 | SFRS7 | 2760408 | 1904 | 0.232 | 0.6572 | Yes | ||
| 26 | SFRS5 | 3450176 6350008 | 2132 | 0.186 | 0.6524 | Yes | ||
| 27 | CPSF1 | 6290064 | 2230 | 0.165 | 0.6537 | Yes | ||
| 28 | SNRPD1 | 4480162 | 2282 | 0.159 | 0.6574 | Yes | ||
| 29 | RNMT | 1770500 | 2444 | 0.136 | 0.6541 | Yes | ||
| 30 | SIP1 | 2640706 | 2447 | 0.135 | 0.6594 | Yes | ||
| 31 | CSTF1 | 4610129 | 2549 | 0.122 | 0.6588 | Yes | ||
| 32 | PHF5A | 2690519 | 2645 | 0.113 | 0.6583 | Yes | ||
| 33 | RNGTT | 780152 780746 1090471 | 2649 | 0.113 | 0.6626 | Yes | ||
| 34 | SNW1 | 4010736 | 2871 | 0.091 | 0.6543 | No | ||
| 35 | FUSIP1 | 520082 5390114 | 3280 | 0.061 | 0.6348 | No | ||
| 36 | PRPF31 | 6100360 | 3307 | 0.060 | 0.6358 | No | ||
| 37 | TXNL4A | 4120286 6510242 | 3360 | 0.057 | 0.6353 | No | ||
| 38 | ELAVL4 | 50735 3360086 5220167 | 3431 | 0.053 | 0.6336 | No | ||
| 39 | CSTF3 | 3850156 5570458 | 3618 | 0.044 | 0.6253 | No | ||
| 40 | CRNKL1 | 5050097 | 3757 | 0.037 | 0.6194 | No | ||
| 41 | NUDT21 | 1240167 | 3830 | 0.034 | 0.6168 | No | ||
| 42 | PPARGC1A | 4670040 | 4434 | 0.019 | 0.5851 | No | ||
| 43 | SLBP | 6220601 | 7017 | 0.002 | 0.4460 | No | ||
| 44 | AUH | 5570152 | 7201 | 0.002 | 0.4362 | No | ||
| 45 | GEMIN6 | 2120288 3830176 | 7434 | 0.001 | 0.4238 | No | ||
| 46 | SF3B3 | 3710044 | 7549 | 0.001 | 0.4177 | No | ||
| 47 | CPSF3 | 2480671 | 7563 | 0.001 | 0.4170 | No | ||
| 48 | SSB | 460286 3140717 | 9915 | -0.005 | 0.2905 | No | ||
| 49 | LSM5 | 4540398 | 10118 | -0.006 | 0.2799 | No | ||
| 50 | CUGBP1 | 450292 510022 7050176 7050215 | 11444 | -0.011 | 0.2089 | No | ||
| 51 | PTBP1 | 4070736 | 14292 | -0.047 | 0.0573 | No | ||
| 52 | NONO | 7050014 | 14613 | -0.056 | 0.0423 | No | ||
| 53 | DDX39 | 3840148 | 15151 | -0.080 | 0.0166 | No | ||
| 54 | SFRS8 | 5130162 5700164 | 15410 | -0.096 | 0.0065 | No | ||
| 55 | SFRS9 | 3800047 | 15791 | -0.131 | -0.0087 | No | ||
| 56 | SNRPD2 | 6110035 | 15964 | -0.153 | -0.0119 | No | ||
| 57 | ZFP36 | 2030605 | 16142 | -0.177 | -0.0143 | No | ||
| 58 | SF3A1 | 1580315 | 16527 | -0.231 | -0.0258 | No | ||
| 59 | GEMIN5 | 3120577 | 16746 | -0.263 | -0.0270 | No | ||
| 60 | SF3A2 | 3140500 | 17628 | -0.466 | -0.0559 | No | ||
| 61 | GEMIN7 | 2320433 | 17727 | -0.498 | -0.0412 | No | ||
| 62 | SFRS10 | 6130528 6400438 7040112 | 18265 | -0.925 | -0.0332 | No | ||
| 63 | SFRS2 | 50707 380593 | 18444 | -1.303 | 0.0093 | No |

