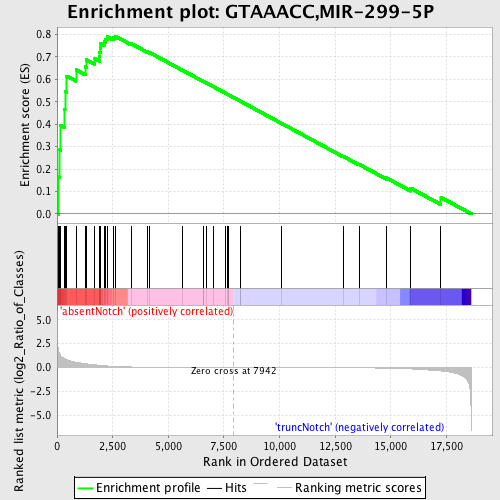
Profile of the Running ES Score & Positions of GeneSet Members on the Rank Ordered List
| Dataset | Set_03_absentNotch_versus_truncNotch.phenotype_absentNotch_versus_truncNotch.cls #absentNotch_versus_truncNotch.phenotype_absentNotch_versus_truncNotch.cls #absentNotch_versus_truncNotch_repos |
| Phenotype | phenotype_absentNotch_versus_truncNotch.cls#absentNotch_versus_truncNotch_repos |
| Upregulated in class | absentNotch |
| GeneSet | GTAAACC,MIR-299-5P |
| Enrichment Score (ES) | 0.79290926 |
| Normalized Enrichment Score (NES) | 1.678504 |
| Nominal p-value | 0.0 |
| FDR q-value | 0.0109186545 |
| FWER p-Value | 0.091 |
| PROBE | DESCRIPTION (from dataset) | GENE SYMBOL | GENE_TITLE | RANK IN GENE LIST | RANK METRIC SCORE | RUNNING ES | CORE ENRICHMENT | |
|---|---|---|---|---|---|---|---|---|
| 1 | SGK | 1400131 2480056 | 52 | 1.889 | 0.1659 | Yes | ||
| 2 | H3F3B | 1410300 | 124 | 1.379 | 0.2852 | Yes | ||
| 3 | CTCF | 5340017 | 161 | 1.243 | 0.3943 | Yes | ||
| 4 | PPP2R5A | 1990497 | 338 | 0.918 | 0.4668 | Yes | ||
| 5 | RAP2C | 1690132 | 356 | 0.898 | 0.5461 | Yes | ||
| 6 | ETF1 | 6770075 | 439 | 0.816 | 0.6145 | Yes | ||
| 7 | SOX4 | 2260091 | 850 | 0.562 | 0.6427 | Yes | ||
| 8 | ZFX | 5900400 | 1275 | 0.399 | 0.6555 | Yes | ||
| 9 | MAFG | 4120440 | 1318 | 0.383 | 0.6874 | Yes | ||
| 10 | PURB | 5360138 | 1700 | 0.280 | 0.6919 | Yes | ||
| 11 | SFRS7 | 2760408 | 1904 | 0.232 | 0.7017 | Yes | ||
| 12 | MAT2A | 4070026 4730079 6020280 | 1915 | 0.232 | 0.7218 | Yes | ||
| 13 | PHF12 | 870400 3130687 | 1944 | 0.222 | 0.7401 | Yes | ||
| 14 | INPP5A | 5910195 | 1966 | 0.218 | 0.7585 | Yes | ||
| 15 | GOLGA1 | 5860471 | 2113 | 0.190 | 0.7676 | Yes | ||
| 16 | ABCD3 | 7040341 | 2182 | 0.176 | 0.7797 | Yes | ||
| 17 | MECP2 | 1940450 | 2251 | 0.163 | 0.7905 | Yes | ||
| 18 | CS | 5080600 | 2524 | 0.125 | 0.7871 | Yes | ||
| 19 | CALU | 2680403 3520056 4610348 5720176 6130121 | 2611 | 0.117 | 0.7929 | Yes | ||
| 20 | TNPO1 | 730092 2260735 | 3330 | 0.058 | 0.7595 | No | ||
| 21 | CNOT3 | 130519 4480292 1990609 | 4061 | 0.027 | 0.7226 | No | ||
| 22 | MAP3K8 | 2940286 | 4165 | 0.024 | 0.7192 | No | ||
| 23 | RSBN1 | 7000487 | 5631 | 0.008 | 0.6410 | No | ||
| 24 | HSPA2 | 6420592 | 6569 | 0.004 | 0.5909 | No | ||
| 25 | TIPARP | 50397 | 6570 | 0.004 | 0.5912 | No | ||
| 26 | MYF6 | 2690576 | 6722 | 0.003 | 0.5834 | No | ||
| 27 | TEAD1 | 2470551 | 7028 | 0.002 | 0.5672 | No | ||
| 28 | ATG5 | 6200433 5360324 | 7589 | 0.001 | 0.5371 | No | ||
| 29 | ROBO1 | 3710398 | 7658 | 0.001 | 0.5335 | No | ||
| 30 | PUM2 | 4200441 5910446 | 7695 | 0.001 | 0.5316 | No | ||
| 31 | ABR | 610079 1170609 3610195 5670050 | 7721 | 0.001 | 0.5304 | No | ||
| 32 | UBE2J2 | 4850019 5420717 | 8224 | -0.001 | 0.5034 | No | ||
| 33 | CAB39 | 5720471 | 8241 | -0.001 | 0.5026 | No | ||
| 34 | MAMDC1 | 3710129 4480075 | 10069 | -0.006 | 0.4048 | No | ||
| 35 | DLX2 | 2320438 4200673 | 12854 | -0.021 | 0.2568 | No | ||
| 36 | TCEAL8 | 4210408 | 13570 | -0.031 | 0.2211 | No | ||
| 37 | CPEB2 | 4760338 | 14801 | -0.063 | 0.1605 | No | ||
| 38 | TSPAN2 | 3940161 | 15892 | -0.142 | 0.1145 | No | ||
| 39 | IPO13 | 3870088 | 17254 | -0.359 | 0.0733 | No |

