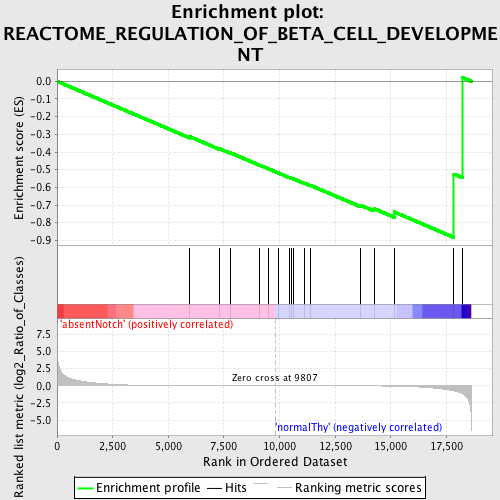
Profile of the Running ES Score & Positions of GeneSet Members on the Rank Ordered List
| Dataset | Set_03_absentNotch_versus_normalThy.phenotype_absentNotch_versus_normalThy.cls #absentNotch_versus_normalThy.phenotype_absentNotch_versus_normalThy.cls #absentNotch_versus_normalThy_repos |
| Phenotype | phenotype_absentNotch_versus_normalThy.cls#absentNotch_versus_normalThy_repos |
| Upregulated in class | normalThy |
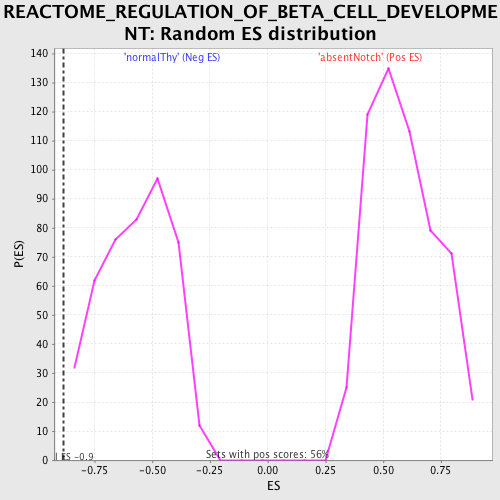
| GeneSet | REACTOME_REGULATION_OF_BETA_CELL_DEVELOPMENT |
| Enrichment Score (ES) | -0.88352925 |
| Normalized Enrichment Score (NES) | -1.5536281 |
| Nominal p-value | 0.004576659 |
| FDR q-value | 0.19658092 |
| FWER p-Value | 0.867 |
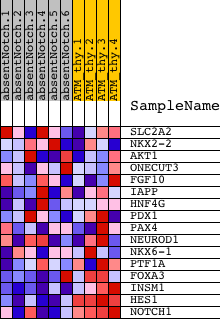
| PROBE | DESCRIPTION (from dataset) | GENE SYMBOL | GENE_TITLE | RANK IN GENE LIST | RANK METRIC SCORE | RUNNING ES | CORE ENRICHMENT | |
|---|---|---|---|---|---|---|---|---|
| 1 | SLC2A2 | 5130537 5720722 6770079 | 5969 | 0.015 | -0.3136 | No | ||
| 2 | NKX2-2 | 4150731 | 7316 | 0.008 | -0.3822 | No | ||
| 3 | AKT1 | 5290746 | 7797 | 0.006 | -0.4051 | No | ||
| 4 | ONECUT3 | 5720487 6100037 | 9098 | 0.002 | -0.4740 | No | ||
| 5 | FGF10 | 730458 840706 | 9510 | 0.001 | -0.4957 | No | ||
| 6 | IAPP | 4230040 | 9964 | -0.001 | -0.5198 | No | ||
| 7 | HNF4G | 5720451 | 10438 | -0.002 | -0.5443 | No | ||
| 8 | PDX1 | 6660647 | 10539 | -0.002 | -0.5487 | No | ||
| 9 | PAX4 | 6620619 | 10643 | -0.002 | -0.5531 | No | ||
| 10 | NEUROD1 | 3060619 | 11107 | -0.004 | -0.5761 | No | ||
| 11 | NKX6-1 | 6040731 | 11368 | -0.005 | -0.5878 | No | ||
| 12 | PTF1A | 6450377 | 13619 | -0.018 | -0.7000 | No | ||
| 13 | FOXA3 | 2680121 | 14245 | -0.027 | -0.7205 | No | ||
| 14 | INSM1 | 3450671 | 15151 | -0.061 | -0.7392 | Yes | ||
| 15 | HES1 | 4810280 | 17836 | -0.736 | -0.5250 | Yes | ||
| 16 | NOTCH1 | 3390114 | 18225 | -1.164 | 0.0210 | Yes |