Profile of the Running ES Score & Positions of GeneSet Members on the Rank Ordered List
| Dataset | Set_03_absentNotch_versus_normalThy.phenotype_absentNotch_versus_normalThy.cls #absentNotch_versus_normalThy.phenotype_absentNotch_versus_normalThy.cls #absentNotch_versus_normalThy_repos |
| Phenotype | phenotype_absentNotch_versus_normalThy.cls#absentNotch_versus_normalThy_repos |
| Upregulated in class | absentNotch |
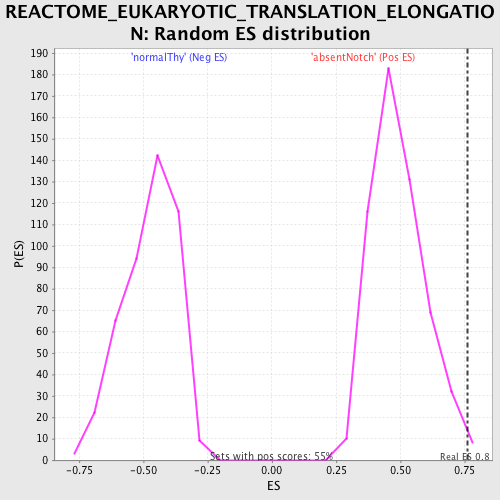
| GeneSet | REACTOME_EUKARYOTIC_TRANSLATION_ELONGATION |
| Enrichment Score (ES) | 0.76214874 |
| Normalized Enrichment Score (NES) | 1.5552994 |
| Nominal p-value | 0.009107468 |
| FDR q-value | 0.07683383 |
| FWER p-Value | 0.75 |
| PROBE | DESCRIPTION (from dataset) | GENE SYMBOL | GENE_TITLE | RANK IN GENE LIST | RANK METRIC SCORE | RUNNING ES | CORE ENRICHMENT | |
|---|---|---|---|---|---|---|---|---|
| 1 | RPL38 | 70040 4060138 6200601 | 2 | 7.446 | 0.4134 | Yes | ||
| 2 | RPL27A | 3130451 110195 6840494 | 72 | 2.999 | 0.5763 | Yes | ||
| 3 | RPS3A | 2470086 | 731 | 0.899 | 0.5908 | Yes | ||
| 4 | RPS19 | 5860066 | 739 | 0.891 | 0.6399 | Yes | ||
| 5 | RPL30 | 4810369 | 890 | 0.783 | 0.6753 | Yes | ||
| 6 | RPS24 | 5420377 | 892 | 0.783 | 0.7188 | Yes | ||
| 7 | EEF1D | 2320524 2510341 | 893 | 0.781 | 0.7621 | Yes | ||
| 8 | RPL14 | 5080471 | 2026 | 0.312 | 0.7185 | No | ||
| 9 | RPS23 | 7100594 | 2190 | 0.268 | 0.7246 | No | ||
| 10 | RPS3 | 1570017 2370170 | 2339 | 0.234 | 0.7296 | No | ||
| 11 | RPL5 | 840095 | 2401 | 0.222 | 0.7387 | No | ||
| 12 | RPLP2 | 5290020 | 2669 | 0.174 | 0.7340 | No | ||
| 13 | RPS4X | 2690020 | 2720 | 0.166 | 0.7405 | No | ||
| 14 | EEF1G | 3940603 | 2917 | 0.137 | 0.7375 | No | ||
| 15 | RPS15A | 1170180 | 3079 | 0.120 | 0.7356 | No | ||
| 16 | RPS2 | 1340647 | 3130 | 0.114 | 0.7392 | No | ||
| 17 | RPL4 | 2940014 5420324 | 3429 | 0.087 | 0.7280 | No | ||
| 18 | RPL18A | 4570619 | 3479 | 0.083 | 0.7300 | No | ||
| 19 | RPL8 | 20296 | 4086 | 0.050 | 0.7002 | No | ||
| 20 | RPL27 | 1940088 | 4356 | 0.041 | 0.6879 | No | ||
| 21 | RPS21 | 3120673 | 4396 | 0.040 | 0.6880 | No | ||
| 22 | RPLP1 | 3140292 | 4652 | 0.032 | 0.6761 | No | ||
| 23 | RPL6 | 6040735 | 4715 | 0.031 | 0.6745 | No | ||
| 24 | RPS17 | 2360528 | 4804 | 0.029 | 0.6714 | No | ||
| 25 | RPS13 | 1570364 | 4892 | 0.028 | 0.6682 | No | ||
| 26 | EEF2 | 1050369 4670035 5890598 | 5042 | 0.025 | 0.6616 | No | ||
| 27 | RPS29 | 580324 | 5574 | 0.018 | 0.6340 | No | ||
| 28 | RPSA | 2360408 2680736 | 5956 | 0.015 | 0.6143 | No | ||
| 29 | RPS25 | 520139 | 6740 | 0.010 | 0.5727 | No | ||
| 30 | RPL39 | 2370446 | 7885 | 0.006 | 0.5115 | No | ||
| 31 | RPL17 | 2690167 5690504 | 8639 | 0.003 | 0.4711 | No | ||
| 32 | RPL18 | 6380181 3870195 | 13681 | -0.018 | 0.2007 | No | ||
| 33 | RPL41 | 6940112 | 13805 | -0.020 | 0.1951 | No | ||
| 34 | RPL37 | 3170494 3870750 4280494 | 13985 | -0.023 | 0.1868 | No | ||
| 35 | RPL35A | 2370706 | 14498 | -0.032 | 0.1610 | No | ||
| 36 | RPS28 | 3830221 | 14895 | -0.046 | 0.1422 | No | ||
| 37 | RPS14 | 430541 | 14898 | -0.046 | 0.1447 | No | ||
| 38 | RPL28 | 6900136 | 14904 | -0.047 | 0.1470 | No | ||
| 39 | RPS15 | 580100 | 14915 | -0.048 | 0.1491 | No | ||
| 40 | RPS16 | 510722 | 15142 | -0.061 | 0.1403 | No | ||
| 41 | RPS5 | 580093 | 15580 | -0.099 | 0.1223 | No | ||
| 42 | RPS11 | 4120403 | 15606 | -0.101 | 0.1266 | No | ||
| 43 | RPL37A | 7040717 | 15622 | -0.102 | 0.1314 | No | ||
| 44 | FAU | 7100465 | 15664 | -0.107 | 0.1352 | No | ||
| 45 | RPS20 | 1740092 | 15738 | -0.114 | 0.1376 | No | ||
| 46 | RPL11 | 3780435 | 16011 | -0.144 | 0.1309 | No | ||
| 47 | RPL19 | 5550592 | 16174 | -0.168 | 0.1315 | No |