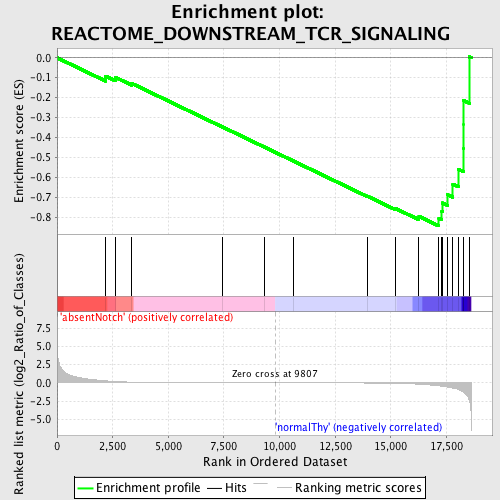
Profile of the Running ES Score & Positions of GeneSet Members on the Rank Ordered List
| Dataset | Set_03_absentNotch_versus_normalThy.phenotype_absentNotch_versus_normalThy.cls #absentNotch_versus_normalThy.phenotype_absentNotch_versus_normalThy.cls #absentNotch_versus_normalThy_repos |
| Phenotype | phenotype_absentNotch_versus_normalThy.cls#absentNotch_versus_normalThy_repos |
| Upregulated in class | normalThy |
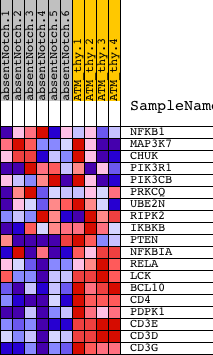
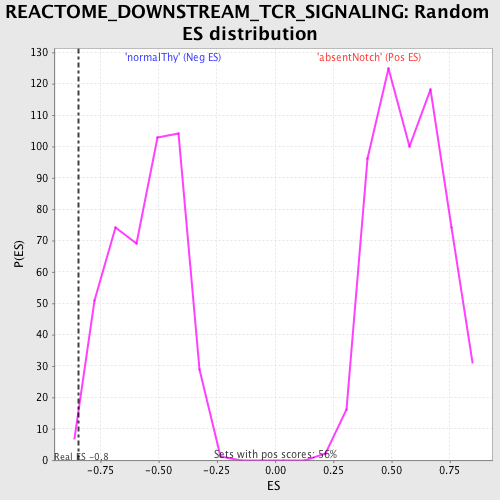
| GeneSet | REACTOME_DOWNSTREAM_TCR_SIGNALING |
| Enrichment Score (ES) | -0.844399 |
| Normalized Enrichment Score (NES) | -1.5313675 |
| Nominal p-value | 0.00913242 |
| FDR q-value | 0.21522403 |
| FWER p-Value | 0.96 |
| PROBE | DESCRIPTION (from dataset) | GENE SYMBOL | GENE_TITLE | RANK IN GENE LIST | RANK METRIC SCORE | RUNNING ES | CORE ENRICHMENT | |
|---|---|---|---|---|---|---|---|---|
| 1 | NFKB1 | 5420358 | 2177 | 0.270 | -0.0916 | No | ||
| 2 | MAP3K7 | 6040068 | 2614 | 0.182 | -0.0978 | No | ||
| 3 | CHUK | 7050736 | 3349 | 0.094 | -0.1284 | No | ||
| 4 | PIK3R1 | 4730671 | 7437 | 0.007 | -0.3475 | No | ||
| 5 | PIK3CB | 3800600 | 9320 | 0.001 | -0.4485 | No | ||
| 6 | PRKCQ | 2260170 3870193 | 10602 | -0.002 | -0.5172 | No | ||
| 7 | UBE2N | 520369 2900047 | 13944 | -0.022 | -0.6948 | No | ||
| 8 | RIPK2 | 5050072 6290632 | 15223 | -0.066 | -0.7572 | No | ||
| 9 | IKBKB | 6840072 | 16263 | -0.180 | -0.7962 | No | ||
| 10 | PTEN | 3390064 | 17161 | -0.403 | -0.8064 | Yes | ||
| 11 | NFKBIA | 1570152 | 17293 | -0.450 | -0.7710 | Yes | ||
| 12 | RELA | 3830075 | 17328 | -0.467 | -0.7288 | Yes | ||
| 13 | LCK | 3360142 | 17548 | -0.561 | -0.6876 | Yes | ||
| 14 | BCL10 | 2360397 | 17788 | -0.705 | -0.6340 | Yes | ||
| 15 | CD4 | 1090010 | 18045 | -0.930 | -0.5600 | Yes | ||
| 16 | PDPK1 | 6650168 | 18263 | -1.250 | -0.4538 | Yes | ||
| 17 | CD3E | 3800056 | 18269 | -1.267 | -0.3346 | Yes | ||
| 18 | CD3D | 2810739 | 18272 | -1.277 | -0.2143 | Yes | ||
| 19 | CD3G | 2680288 | 18531 | -2.468 | 0.0046 | Yes |