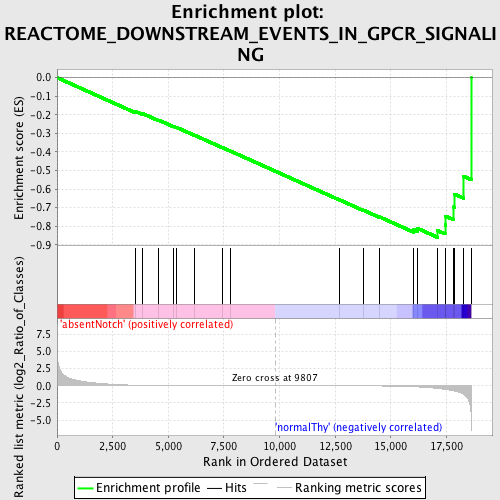
Profile of the Running ES Score & Positions of GeneSet Members on the Rank Ordered List
| Dataset | Set_03_absentNotch_versus_normalThy.phenotype_absentNotch_versus_normalThy.cls #absentNotch_versus_normalThy.phenotype_absentNotch_versus_normalThy.cls #absentNotch_versus_normalThy_repos |
| Phenotype | phenotype_absentNotch_versus_normalThy.cls#absentNotch_versus_normalThy_repos |
| Upregulated in class | normalThy |
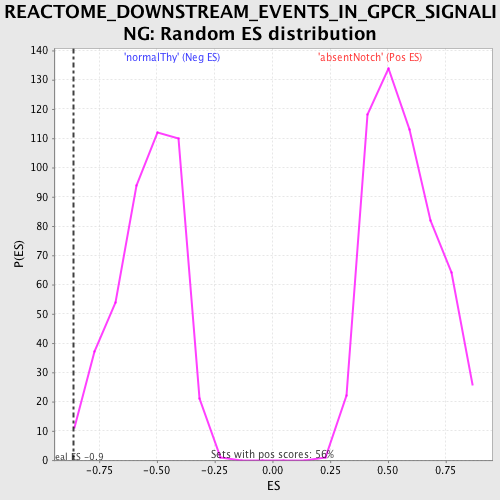
| GeneSet | REACTOME_DOWNSTREAM_EVENTS_IN_GPCR_SIGNALING |
| Enrichment Score (ES) | -0.8605231 |
| Normalized Enrichment Score (NES) | -1.6079526 |
| Nominal p-value | 0.006818182 |
| FDR q-value | 0.12555265 |
| FWER p-Value | 0.518 |
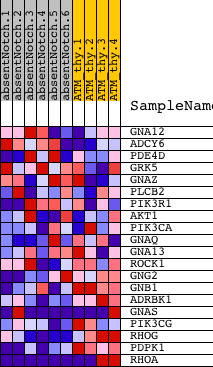
| PROBE | DESCRIPTION (from dataset) | GENE SYMBOL | GENE_TITLE | RANK IN GENE LIST | RANK METRIC SCORE | RUNNING ES | CORE ENRICHMENT | |
|---|---|---|---|---|---|---|---|---|
| 1 | GNA12 | 1230301 | 3521 | 0.080 | -0.1818 | No | ||
| 2 | ADCY6 | 450364 6290670 6940286 | 3840 | 0.061 | -0.1931 | No | ||
| 3 | PDE4D | 2470528 6660014 | 4558 | 0.035 | -0.2284 | No | ||
| 4 | GRK5 | 1940348 4670053 | 5251 | 0.022 | -0.2635 | No | ||
| 5 | GNAZ | 6130296 | 5387 | 0.020 | -0.2689 | No | ||
| 6 | PLCB2 | 360132 | 6195 | 0.013 | -0.3110 | No | ||
| 7 | PIK3R1 | 4730671 | 7437 | 0.007 | -0.3770 | No | ||
| 8 | AKT1 | 5290746 | 7797 | 0.006 | -0.3958 | No | ||
| 9 | PIK3CA | 6220129 | 12684 | -0.010 | -0.6575 | No | ||
| 10 | GNAQ | 430670 4210131 5900736 | 13759 | -0.019 | -0.7135 | No | ||
| 11 | GNA13 | 4590102 | 14479 | -0.032 | -0.7491 | No | ||
| 12 | ROCK1 | 130044 | 16034 | -0.147 | -0.8188 | No | ||
| 13 | GNG2 | 2230390 | 16198 | -0.171 | -0.8115 | No | ||
| 14 | GNB1 | 2120397 | 17111 | -0.389 | -0.8239 | Yes | ||
| 15 | ADRBK1 | 1340333 | 17439 | -0.512 | -0.7933 | Yes | ||
| 16 | GNAS | 630441 1850373 4050152 | 17449 | -0.517 | -0.7450 | Yes | ||
| 17 | PIK3CG | 5890110 | 17834 | -0.735 | -0.6965 | Yes | ||
| 18 | RHOG | 6760575 | 17856 | -0.752 | -0.6268 | Yes | ||
| 19 | PDPK1 | 6650168 | 18263 | -1.250 | -0.5308 | Yes | ||
| 20 | RHOA | 580142 5900131 5340450 | 18613 | -5.837 | 0.0002 | Yes |