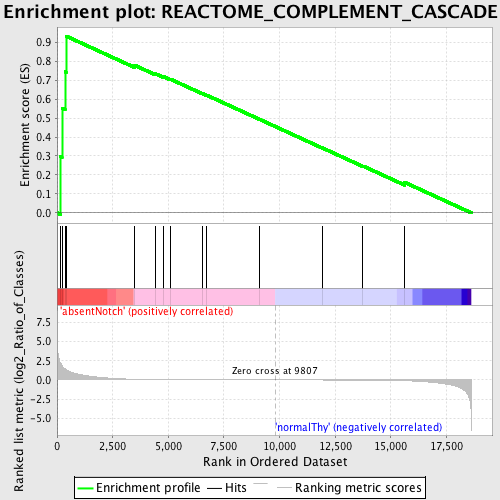
Profile of the Running ES Score & Positions of GeneSet Members on the Rank Ordered List
| Dataset | Set_03_absentNotch_versus_normalThy.phenotype_absentNotch_versus_normalThy.cls #absentNotch_versus_normalThy.phenotype_absentNotch_versus_normalThy.cls #absentNotch_versus_normalThy_repos |
| Phenotype | phenotype_absentNotch_versus_normalThy.cls#absentNotch_versus_normalThy_repos |
| Upregulated in class | absentNotch |
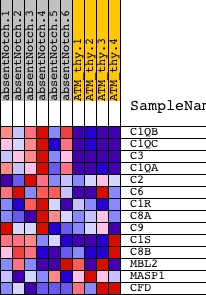
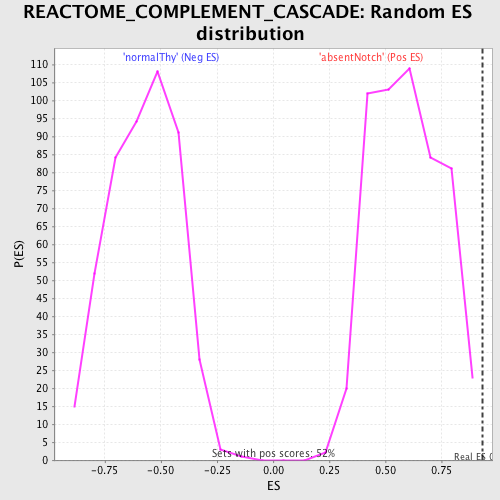
| GeneSet | REACTOME_COMPLEMENT_CASCADE |
| Enrichment Score (ES) | 0.9319687 |
| Normalized Enrichment Score (NES) | 1.5659161 |
| Nominal p-value | 0.001908397 |
| FDR q-value | 0.06769677 |
| FWER p-Value | 0.641 |
| PROBE | DESCRIPTION (from dataset) | GENE SYMBOL | GENE_TITLE | RANK IN GENE LIST | RANK METRIC SCORE | RUNNING ES | CORE ENRICHMENT | |
|---|---|---|---|---|---|---|---|---|
| 1 | C1QB | 5910292 | 159 | 2.145 | 0.2963 | Yes | ||
| 2 | C1QC | 5700131 | 222 | 1.814 | 0.5508 | Yes | ||
| 3 | C3 | 1740372 | 360 | 1.415 | 0.7446 | Yes | ||
| 4 | C1QA | 5390687 | 406 | 1.336 | 0.9320 | Yes | ||
| 5 | C2 | 5390465 | 3491 | 0.083 | 0.7779 | No | ||
| 6 | C6 | 1770154 2900129 | 4429 | 0.038 | 0.7330 | No | ||
| 7 | C1R | 2340025 3290152 4850452 | 4785 | 0.029 | 0.7181 | No | ||
| 8 | C8A | 2190601 | 5108 | 0.024 | 0.7042 | No | ||
| 9 | C9 | 5550452 5690253 | 6513 | 0.011 | 0.6304 | No | ||
| 10 | C1S | 840184 6840114 | 6724 | 0.010 | 0.6205 | No | ||
| 11 | C8B | 6770687 | 9096 | 0.002 | 0.4934 | No | ||
| 12 | MBL2 | 6370446 | 11923 | -0.007 | 0.3424 | No | ||
| 13 | MASP1 | 1780619 2900066 | 13748 | -0.019 | 0.2471 | No | ||
| 14 | CFD | 2320736 | 15624 | -0.102 | 0.1608 | No |