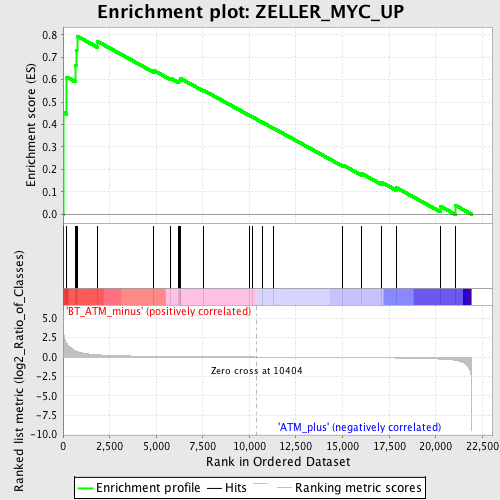
Profile of the Running ES Score & Positions of GeneSet Members on the Rank Ordered List
| Dataset | Set_02_BT_ATM_minus_versus_ATM_plus.phenotype_BT_ATM_minus_versus_ATM_plus.cls #BT_ATM_minus_versus_ATM_plus.phenotype_BT_ATM_minus_versus_ATM_plus.cls #BT_ATM_minus_versus_ATM_plus_repos |
| Phenotype | phenotype_BT_ATM_minus_versus_ATM_plus.cls#BT_ATM_minus_versus_ATM_plus_repos |
| Upregulated in class | BT_ATM_minus |
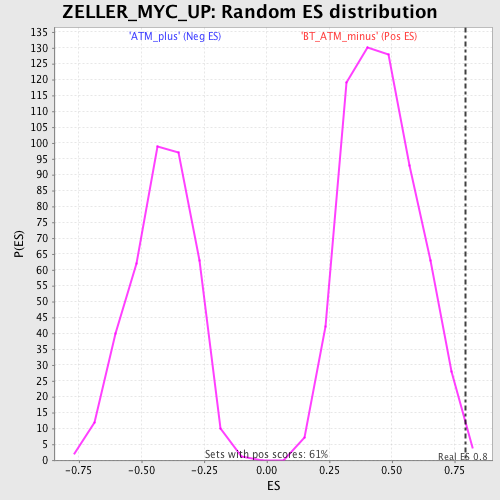
| GeneSet | ZELLER_MYC_UP |
| Enrichment Score (ES) | 0.793956 |
| Normalized Enrichment Score (NES) | 1.733316 |
| Nominal p-value | 0.0065146578 |
| FDR q-value | 0.7672136 |
| FWER p-Value | 0.836 |
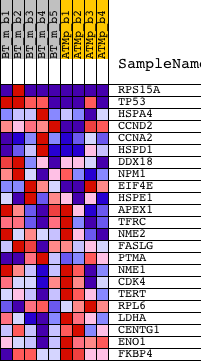
| PROBE | DESCRIPTION (from dataset) | GENE SYMBOL | GENE_TITLE | RANK IN GENE LIST | RANK METRIC SCORE | RUNNING ES | CORE ENRICHMENT | |
|---|---|---|---|---|---|---|---|---|
| 1 | RPS15A | 1453467_s_at 1457726_at | 7 | 4.826 | 0.4537 | Yes | ||
| 2 | TP53 | 1426538_a_at 1427739_a_at 1438808_at 1457623_x_at 1459780_at 1459781_x_at | 192 | 1.767 | 0.6116 | Yes | ||
| 3 | HSPA4 | 1416146_at 1416147_at 1440575_at | 667 | 0.780 | 0.6634 | Yes | ||
| 4 | CCND2 | 1416122_at 1416123_at 1416124_at 1430127_a_at 1434745_at 1448229_s_at 1455956_x_at | 722 | 0.724 | 0.7290 | Yes | ||
| 5 | CCNA2 | 1417910_at 1417911_at | 746 | 0.702 | 0.7940 | Yes | ||
| 6 | HSPD1 | 1426351_at | 1860 | 0.283 | 0.7698 | No | ||
| 7 | DDX18 | 1416070_a_at 1416071_at 1456000_at | 4873 | 0.090 | 0.6408 | No | ||
| 8 | NPM1 | 1415839_a_at 1420267_at 1420268_x_at 1420269_at 1432416_a_at | 5781 | 0.070 | 0.6060 | No | ||
| 9 | EIF4E | 1450909_at 1457489_at 1459371_at | 6217 | 0.062 | 0.5920 | No | ||
| 10 | HSPE1 | 1450668_s_at | 6259 | 0.061 | 0.5958 | No | ||
| 11 | APEX1 | 1416135_at 1437715_x_at 1456079_x_at | 6289 | 0.060 | 0.6002 | No | ||
| 12 | TFRC | 1422966_a_at 1422967_a_at 1452661_at AFFX-TransRecMur/X57349_3_at AFFX-TransRecMur/X57349_5_at AFFX-TransRecMur/X57349_M_at | 6324 | 0.060 | 0.6043 | No | ||
| 13 | NME2 | 1448808_a_at | 7547 | 0.039 | 0.5522 | No | ||
| 14 | FASLG | 1418803_a_at 1449235_at | 10009 | 0.005 | 0.4404 | No | ||
| 15 | PTMA | 1423455_at | 10147 | 0.003 | 0.4345 | No | ||
| 16 | NME1 | 1424110_a_at 1435277_x_at | 10720 | -0.004 | 0.4087 | No | ||
| 17 | CDK4 | 1422441_x_at | 11275 | -0.011 | 0.3845 | No | ||
| 18 | TERT | 1450254_at 1456941_at | 15029 | -0.066 | 0.2194 | No | ||
| 19 | RPL6 | 1416546_a_at | 16023 | -0.083 | 0.1819 | No | ||
| 20 | LDHA | 1419737_a_at | 17079 | -0.107 | 0.1438 | No | ||
| 21 | CENTG1 | 1419789_at | 17899 | -0.130 | 0.1186 | No | ||
| 22 | ENO1 | 1419023_x_at | 20271 | -0.266 | 0.0355 | No | ||
| 23 | FKBP4 | 1416362_a_at 1416363_at 1458729_at 1459808_at | 21068 | -0.429 | 0.0395 | No |