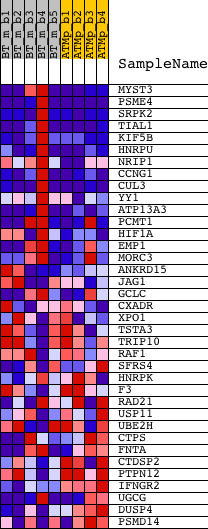
Profile of the Running ES Score & Positions of GeneSet Members on the Rank Ordered List
| Dataset | Set_02_BT_ATM_minus_versus_ATM_plus.phenotype_BT_ATM_minus_versus_ATM_plus.cls #BT_ATM_minus_versus_ATM_plus.phenotype_BT_ATM_minus_versus_ATM_plus.cls #BT_ATM_minus_versus_ATM_plus_repos |
| Phenotype | phenotype_BT_ATM_minus_versus_ATM_plus.cls#BT_ATM_minus_versus_ATM_plus_repos |
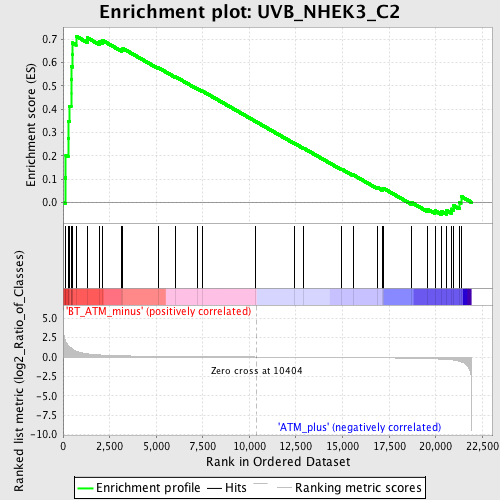
| Upregulated in class | BT_ATM_minus |
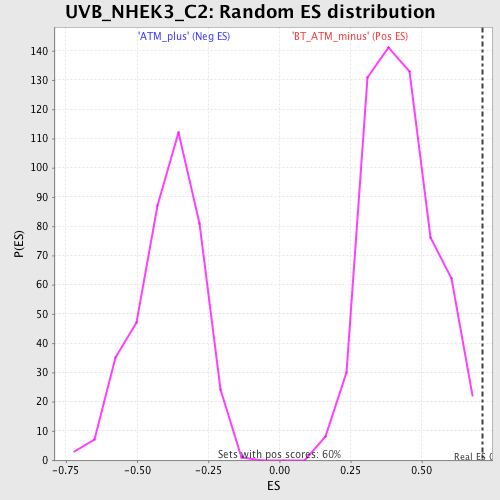
| GeneSet | UVB_NHEK3_C2 |
| Enrichment Score (ES) | 0.71347874 |
| Normalized Enrichment Score (NES) | 1.6731774 |
| Nominal p-value | 0.0016583748 |
| FDR q-value | 0.52046525 |
| FWER p-Value | 0.987 |
| PROBE | DESCRIPTION (from dataset) | GENE SYMBOL | GENE_TITLE | RANK IN GENE LIST | RANK METRIC SCORE | RUNNING ES | CORE ENRICHMENT | |
|---|---|---|---|---|---|---|---|---|
| 1 | MYST3 | 1436315_at 1437487_at 1446143_at 1446405_at | 109 | 2.189 | 0.1058 | Yes | ||
| 2 | PSME4 | 1426823_s_at 1426824_at 1440511_at 1445147_at 1446464_at 1452211_at | 150 | 1.921 | 0.2012 | Yes | ||
| 3 | SRPK2 | 1417134_at 1417135_at 1417136_s_at 1431372_at 1435746_at 1440080_at 1442241_at 1442980_at 1447755_at 1448603_at | 268 | 1.526 | 0.2731 | Yes | ||
| 4 | TIAL1 | 1421148_a_at 1426352_s_at 1446713_at 1452821_at 1455675_a_at 1455676_x_at | 281 | 1.499 | 0.3484 | Yes | ||
| 5 | KIF5B | 1418427_at 1418428_at 1418429_at 1418430_at 1418431_at | 347 | 1.338 | 0.4132 | Yes | ||
| 6 | HNRPU | 1423050_s_at 1423051_at 1434390_at 1434391_at 1450849_at | 427 | 1.165 | 0.4685 | Yes | ||
| 7 | NRIP1 | 1418469_at 1432603_at 1434384_at 1446389_at 1447211_at 1449089_at 1454295_at | 428 | 1.160 | 0.5272 | Yes | ||
| 8 | CCNG1 | 1420827_a_at 1450016_at 1450017_at | 456 | 1.111 | 0.5822 | Yes | ||
| 9 | CUL3 | 1422794_at 1422795_at 1434717_at 1434718_at 1450756_s_at | 489 | 1.033 | 0.6330 | Yes | ||
| 10 | YY1 | 1422569_at 1422570_at 1435824_at 1457834_at | 496 | 1.017 | 0.6842 | Yes | ||
| 11 | ATP13A3 | 1434513_at 1442145_at 1443868_at | 694 | 0.756 | 0.7135 | Yes | ||
| 12 | PCMT1 | 1422665_a_at 1431085_a_at 1431086_s_at 1456604_a_at | 1313 | 0.407 | 0.7058 | No | ||
| 13 | HIF1A | 1427418_a_at 1431981_at 1448183_a_at 1457231_at | 1969 | 0.265 | 0.6893 | No | ||
| 14 | EMP1 | 1416529_at 1459171_at | 2117 | 0.245 | 0.6951 | No | ||
| 15 | MORC3 | 1420091_s_at 1420092_at 1452224_at | 3136 | 0.153 | 0.6563 | No | ||
| 16 | ANKRD15 | 1433742_at 1444711_at | 3211 | 0.149 | 0.6605 | No | ||
| 17 | JAG1 | 1421105_at 1421106_at 1434070_at | 5122 | 0.084 | 0.5775 | No | ||
| 18 | GCLC | 1424296_at | 6016 | 0.066 | 0.5401 | No | ||
| 19 | CXADR | 1427321_s_at 1449949_a_at 1451865_at 1452391_at 1453282_at | 7229 | 0.044 | 0.4870 | No | ||
| 20 | XPO1 | 1418442_at 1418443_at 1448070_at | 7471 | 0.041 | 0.4780 | No | ||
| 21 | TSTA3 | 1448495_at | 10343 | 0.001 | 0.3470 | No | ||
| 22 | TRIP10 | 1418092_s_at | 12410 | -0.026 | 0.2539 | No | ||
| 23 | RAF1 | 1416078_s_at 1425419_a_at | 12932 | -0.033 | 0.2318 | No | ||
| 24 | SFRS4 | 1448778_at | 14965 | -0.064 | 0.1423 | No | ||
| 25 | HNRPK | 1423684_at 1448176_a_at 1454692_x_at 1460547_a_at | 15570 | -0.075 | 0.1185 | No | ||
| 26 | F3 | 1417408_at | 16860 | -0.101 | 0.0647 | No | ||
| 27 | RAD21 | 1416161_at 1416162_at 1455938_x_at | 17142 | -0.109 | 0.0574 | No | ||
| 28 | USP11 | 1426539_at | 17200 | -0.110 | 0.0604 | No | ||
| 29 | UBE2H | 1418631_at 1418632_at 1428791_at 1438971_x_at 1447374_at 1459930_at | 18707 | -0.157 | -0.0004 | No | ||
| 30 | CTPS | 1416563_at | 19568 | -0.201 | -0.0295 | No | ||
| 31 | FNTA | 1417465_at 1447904_s_at | 19971 | -0.233 | -0.0361 | No | ||
| 32 | CTDSP2 | 1423660_at 1423661_s_at 1451075_s_at | 20320 | -0.272 | -0.0382 | No | ||
| 33 | PTPN12 | 1422045_a_at 1439705_at 1450478_a_at 1450479_x_at 1455105_at 1459459_at | 20585 | -0.310 | -0.0346 | No | ||
| 34 | IFNGR2 | 1423557_at 1423558_at | 20850 | -0.361 | -0.0284 | No | ||
| 35 | UGCG | 1421268_at 1421269_at 1435133_at 1439863_at | 20964 | -0.393 | -0.0137 | No | ||
| 36 | DUSP4 | 1428834_at | 21280 | -0.541 | -0.0007 | No | ||
| 37 | PSMD14 | 1421751_a_at 1446521_at 1457765_at 1459734_at | 21367 | -0.603 | 0.0259 | No |