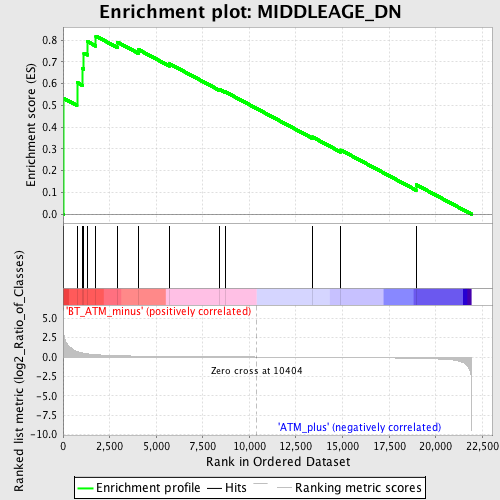
Profile of the Running ES Score & Positions of GeneSet Members on the Rank Ordered List
| Dataset | Set_02_BT_ATM_minus_versus_ATM_plus.phenotype_BT_ATM_minus_versus_ATM_plus.cls #BT_ATM_minus_versus_ATM_plus.phenotype_BT_ATM_minus_versus_ATM_plus.cls #BT_ATM_minus_versus_ATM_plus_repos |
| Phenotype | phenotype_BT_ATM_minus_versus_ATM_plus.cls#BT_ATM_minus_versus_ATM_plus_repos |
| Upregulated in class | BT_ATM_minus |
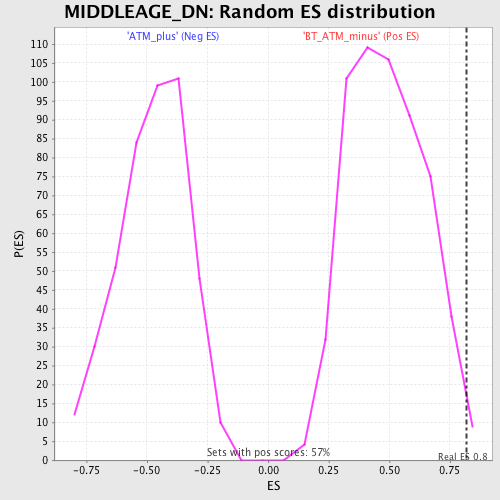
| GeneSet | MIDDLEAGE_DN |
| Enrichment Score (ES) | 0.8181719 |
| Normalized Enrichment Score (NES) | 1.6647508 |
| Nominal p-value | 0.003539823 |
| FDR q-value | 0.3665198 |
| FWER p-Value | 0.993 |
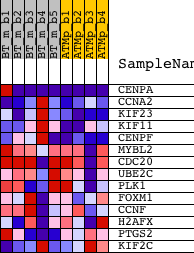
| PROBE | DESCRIPTION (from dataset) | GENE SYMBOL | GENE_TITLE | RANK IN GENE LIST | RANK METRIC SCORE | RUNNING ES | CORE ENRICHMENT | |
|---|---|---|---|---|---|---|---|---|
| 1 | CENPA | 1441864_x_at 1444416_at 1450842_a_at | 24 | 3.525 | 0.5322 | Yes | ||
| 2 | CCNA2 | 1417910_at 1417911_at | 746 | 0.702 | 0.6054 | Yes | ||
| 3 | KIF23 | 1450827_at 1453748_a_at 1455990_at | 1051 | 0.512 | 0.6690 | Yes | ||
| 4 | KIF11 | 1435306_a_at 1452314_at 1452315_at | 1118 | 0.485 | 0.7393 | Yes | ||
| 5 | CENPF | 1427161_at 1452334_at 1458447_at | 1294 | 0.413 | 0.7937 | Yes | ||
| 6 | MYBL2 | 1417656_at 1454946_at | 1761 | 0.302 | 0.8182 | Yes | ||
| 7 | CDC20 | 1416664_at 1439377_x_at 1439394_x_at | 2928 | 0.166 | 0.7900 | No | ||
| 8 | UBE2C | 1452954_at | 4036 | 0.115 | 0.7568 | No | ||
| 9 | PLK1 | 1443408_at 1448191_at 1459616_at | 5709 | 0.072 | 0.6914 | No | ||
| 10 | FOXM1 | 1417748_x_at 1437138_at 1448833_at 1448834_at | 8378 | 0.027 | 0.5738 | No | ||
| 11 | CCNF | 1422513_at 1443807_x_at | 8700 | 0.023 | 0.5626 | No | ||
| 12 | H2AFX | 1416746_at | 13384 | -0.040 | 0.3550 | No | ||
| 13 | PTGS2 | 1417262_at 1417263_at | 14908 | -0.063 | 0.2951 | No | ||
| 14 | KIF2C | 1432392_at 1437611_x_at 1454221_a_at | 18956 | -0.168 | 0.1359 | No |