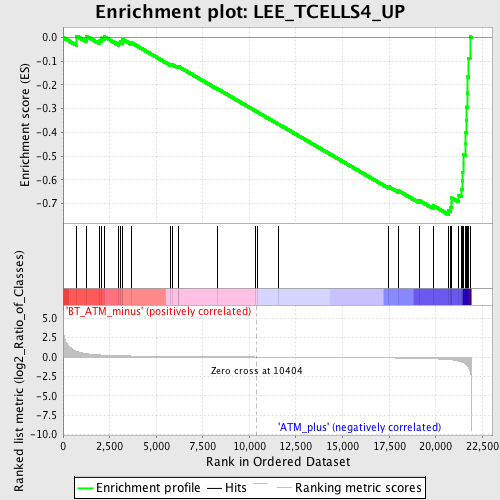
Profile of the Running ES Score & Positions of GeneSet Members on the Rank Ordered List
| Dataset | Set_02_BT_ATM_minus_versus_ATM_plus.phenotype_BT_ATM_minus_versus_ATM_plus.cls #BT_ATM_minus_versus_ATM_plus.phenotype_BT_ATM_minus_versus_ATM_plus.cls #BT_ATM_minus_versus_ATM_plus_repos |
| Phenotype | phenotype_BT_ATM_minus_versus_ATM_plus.cls#BT_ATM_minus_versus_ATM_plus_repos |
| Upregulated in class | ATM_plus |
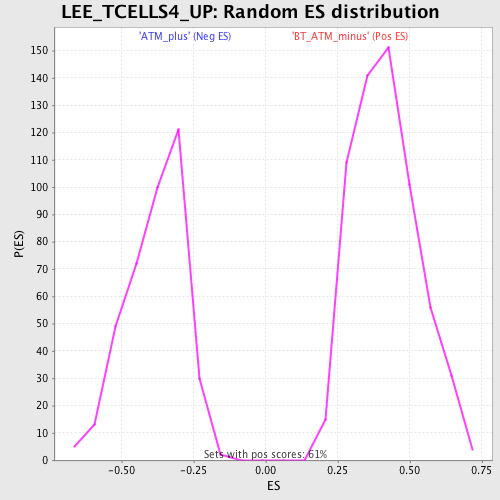
| GeneSet | LEE_TCELLS4_UP |
| Enrichment Score (ES) | -0.74561864 |
| Normalized Enrichment Score (NES) | -1.9541092 |
| Nominal p-value | 0.0 |
| FDR q-value | 0.13468869 |
| FWER p-Value | 0.205 |
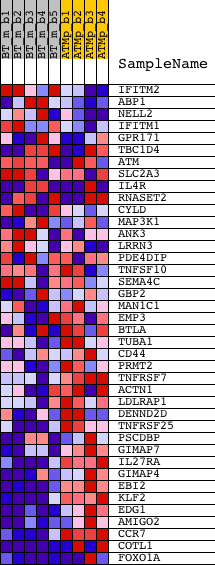
| PROBE | DESCRIPTION (from dataset) | GENE SYMBOL | GENE_TITLE | RANK IN GENE LIST | RANK METRIC SCORE | RUNNING ES | CORE ENRICHMENT | |
|---|---|---|---|---|---|---|---|---|
| 1 | IFITM2 | 1417460_at | 734 | 0.711 | 0.0056 | No | ||
| 2 | ABP1 | 1420709_s_at 1424600_at | 1252 | 0.433 | 0.0058 | No | ||
| 3 | NELL2 | 1423560_at 1423561_at | 1977 | 0.264 | -0.0127 | No | ||
| 4 | IFITM1 | 1424254_at | 2050 | 0.253 | -0.0021 | No | ||
| 5 | GPR171 | 1438439_at | 2221 | 0.233 | 0.0030 | No | ||
| 6 | TBC1D4 | 1435292_at 1455903_at | 2989 | 0.162 | -0.0231 | No | ||
| 7 | ATM | 1421205_at 1428830_at | 3060 | 0.158 | -0.0176 | No | ||
| 8 | SLC2A3 | 1421924_at 1427770_a_at 1437052_s_at 1455898_x_at | 3194 | 0.150 | -0.0154 | No | ||
| 9 | IL4R | 1421034_a_at 1423996_a_at 1447858_x_at | 3195 | 0.150 | -0.0072 | No | ||
| 10 | RNASET2 | 1431785_at 1452734_at 1456012_x_at | 3658 | 0.129 | -0.0212 | No | ||
| 11 | CYLD | 1429617_at 1429618_at 1445213_at | 5742 | 0.071 | -0.1124 | No | ||
| 12 | MAP3K1 | 1424850_at | 5859 | 0.069 | -0.1140 | No | ||
| 13 | ANK3 | 1425202_a_at 1439220_at 1447259_at 1451628_a_at 1457288_at | 6173 | 0.063 | -0.1248 | No | ||
| 14 | LRRN3 | 1434539_at | 6193 | 0.062 | -0.1222 | No | ||
| 15 | PDE4DIP | 1417626_at 1433761_at 1456413_at 1460426_at | 8264 | 0.029 | -0.2152 | No | ||
| 16 | TNFSF10 | 1420412_at 1439680_at 1459913_at | 10357 | 0.001 | -0.3107 | No | ||
| 17 | SEMA4C | 1433920_at | 10425 | -0.000 | -0.3137 | No | ||
| 18 | GBP2 | 1418240_at 1435906_x_at | 11561 | -0.015 | -0.3648 | No | ||
| 19 | MAN1C1 | 1436193_at | 17477 | -0.118 | -0.6284 | No | ||
| 20 | EMP3 | 1417104_at | 17994 | -0.133 | -0.6447 | No | ||
| 21 | BTLA | 1455656_at | 19139 | -0.176 | -0.6873 | No | ||
| 22 | TUBA1 | 1418884_x_at | 19871 | -0.224 | -0.7083 | No | ||
| 23 | CD44 | 1423760_at 1434376_at 1443265_at 1452483_a_at | 20689 | -0.327 | -0.7276 | Yes | ||
| 24 | PRMT2 | 1416844_at 1437234_x_at | 20821 | -0.353 | -0.7142 | Yes | ||
| 25 | TNFRSF7 | 1452389_at | 20868 | -0.366 | -0.6961 | Yes | ||
| 26 | ACTN1 | 1427385_s_at 1428585_at 1452415_at | 20870 | -0.366 | -0.6760 | Yes | ||
| 27 | LDLRAP1 | 1424378_at 1457162_at | 21215 | -0.493 | -0.6646 | Yes | ||
| 28 | DENND2D | 1438712_at 1451363_a_at | 21372 | -0.607 | -0.6383 | Yes | ||
| 29 | TNFRSF25 | 1422231_a_at | 21442 | -0.674 | -0.6044 | Yes | ||
| 30 | PSCDBP | 1435697_a_at 1451206_s_at | 21450 | -0.679 | -0.5673 | Yes | ||
| 31 | GIMAP7 | 1425084_at 1444283_at | 21475 | -0.703 | -0.5297 | Yes | ||
| 32 | IL27RA | 1449508_at | 21476 | -0.706 | -0.4909 | Yes | ||
| 33 | GIMAP4 | 1424374_at 1424375_s_at | 21601 | -0.871 | -0.4486 | Yes | ||
| 34 | EBI2 | 1437356_at 1457691_at | 21604 | -0.874 | -0.4006 | Yes | ||
| 35 | KLF2 | 1448890_at | 21659 | -0.994 | -0.3484 | Yes | ||
| 36 | EDG1 | 1423571_at | 21670 | -1.019 | -0.2927 | Yes | ||
| 37 | AMIGO2 | 1434601_at 1447769_x_at | 21698 | -1.101 | -0.2334 | Yes | ||
| 38 | CCR7 | 1423466_at | 21736 | -1.255 | -0.1660 | Yes | ||
| 39 | COTL1 | 1416001_a_at 1416002_x_at 1425801_x_at 1436236_x_at 1436838_x_at 1437811_x_at | 21789 | -1.473 | -0.0873 | Yes | ||
| 40 | FOXO1A | 1416981_at 1416982_at 1416983_s_at 1459170_at | 21853 | -1.705 | 0.0037 | Yes |