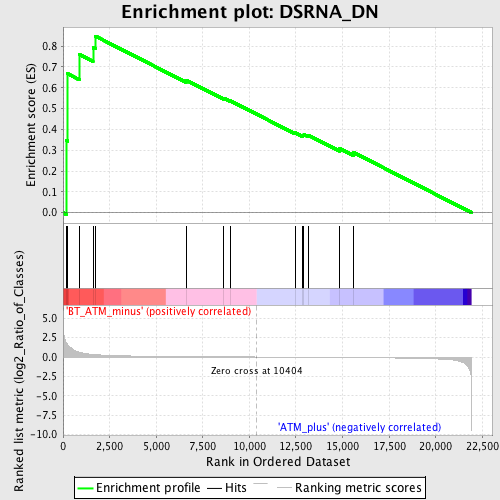
Profile of the Running ES Score & Positions of GeneSet Members on the Rank Ordered List
| Dataset | Set_02_BT_ATM_minus_versus_ATM_plus.phenotype_BT_ATM_minus_versus_ATM_plus.cls #BT_ATM_minus_versus_ATM_plus.phenotype_BT_ATM_minus_versus_ATM_plus.cls #BT_ATM_minus_versus_ATM_plus_repos |
| Phenotype | phenotype_BT_ATM_minus_versus_ATM_plus.cls#BT_ATM_minus_versus_ATM_plus_repos |
| Upregulated in class | BT_ATM_minus |
| GeneSet | DSRNA_DN |
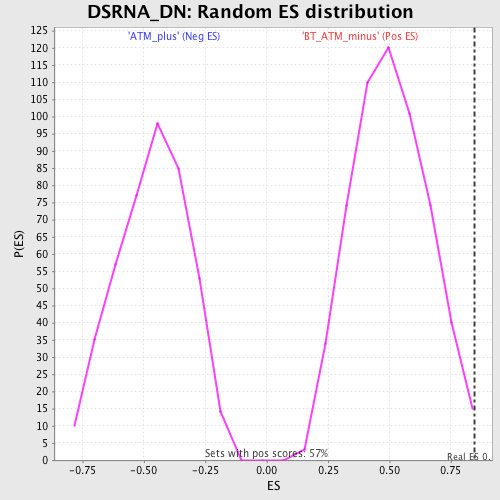
| Enrichment Score (ES) | 0.8482322 |
| Normalized Enrichment Score (NES) | 1.6865159 |
| Nominal p-value | 0.0052539404 |
| FDR q-value | 0.67973876 |
| FWER p-Value | 0.973 |
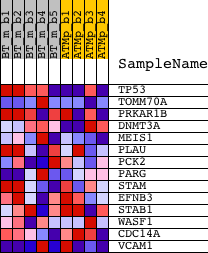
| PROBE | DESCRIPTION (from dataset) | GENE SYMBOL | GENE_TITLE | RANK IN GENE LIST | RANK METRIC SCORE | RUNNING ES | CORE ENRICHMENT | |
|---|---|---|---|---|---|---|---|---|
| 1 | TP53 | 1426538_a_at 1427739_a_at 1438808_at 1457623_x_at 1459780_at 1459781_x_at | 192 | 1.767 | 0.3454 | Yes | ||
| 2 | TOMM70A | 1417192_at 1426675_at 1426676_s_at 1447239_at 1457353_at | 237 | 1.618 | 0.6676 | Yes | ||
| 3 | PRKAR1B | 1416753_at 1416754_at 1434325_x_at 1440132_s_at 1440133_x_at 1460073_at | 879 | 0.603 | 0.7594 | Yes | ||
| 4 | DNMT3A | 1423063_at 1423064_at 1423065_at 1423066_at 1442309_at 1460324_at | 1607 | 0.330 | 0.7923 | Yes | ||
| 5 | MEIS1 | 1440431_at 1443260_at 1445773_at 1450992_a_at 1459423_at 1459512_at | 1732 | 0.307 | 0.8482 | Yes | ||
| 6 | PLAU | 1422138_at 1422139_at | 6605 | 0.055 | 0.6370 | No | ||
| 7 | PCK2 | 1425615_a_at 1452620_at | 8617 | 0.024 | 0.5501 | No | ||
| 8 | PARG | 1448725_at | 8967 | 0.019 | 0.5380 | No | ||
| 9 | STAM | 1416861_at 1416862_at 1457828_at 1459427_at | 12477 | -0.027 | 0.3833 | No | ||
| 10 | EFNB3 | 1423085_at | 12847 | -0.032 | 0.3729 | No | ||
| 11 | STAB1 | 1450199_a_at | 12934 | -0.033 | 0.3756 | No | ||
| 12 | WASF1 | 1418545_at 1440438_at | 13181 | -0.037 | 0.3717 | No | ||
| 13 | CDC14A | 1436913_at 1443184_at 1446493_at 1459517_at | 14844 | -0.062 | 0.3084 | No | ||
| 14 | VCAM1 | 1415989_at 1436003_at 1448162_at 1451314_a_at | 15580 | -0.075 | 0.2899 | No |