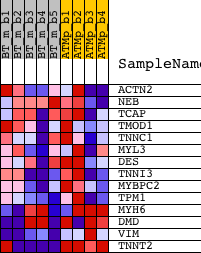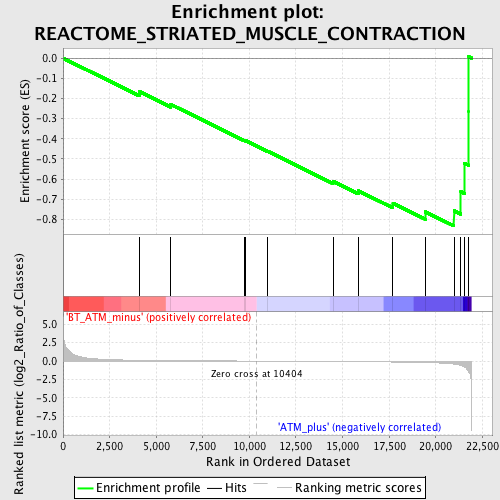
Profile of the Running ES Score & Positions of GeneSet Members on the Rank Ordered List
| Dataset | Set_02_BT_ATM_minus_versus_ATM_plus.phenotype_BT_ATM_minus_versus_ATM_plus.cls #BT_ATM_minus_versus_ATM_plus.phenotype_BT_ATM_minus_versus_ATM_plus.cls #BT_ATM_minus_versus_ATM_plus_repos |
| Phenotype | phenotype_BT_ATM_minus_versus_ATM_plus.cls#BT_ATM_minus_versus_ATM_plus_repos |
| Upregulated in class | ATM_plus |
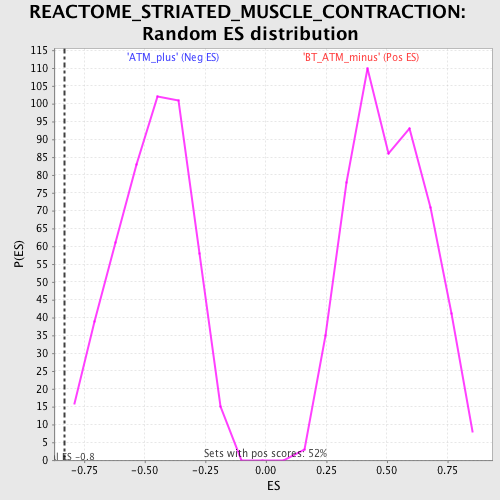
| GeneSet | REACTOME_STRIATED_MUSCLE_CONTRACTION |
| Enrichment Score (ES) | -0.8328666 |
| Normalized Enrichment Score (NES) | -1.778606 |
| Nominal p-value | 0.002105263 |
| FDR q-value | 0.22169398 |
| FWER p-Value | 0.802 |
| PROBE | DESCRIPTION (from dataset) | GENE SYMBOL | GENE_TITLE | RANK IN GENE LIST | RANK METRIC SCORE | RUNNING ES | CORE ENRICHMENT | |
|---|---|---|---|---|---|---|---|---|
| 1 | ACTN2 | 1448327_at 1456968_at | 4093 | 0.112 | -0.1656 | No | ||
| 2 | NEB | 1435355_at | 5784 | 0.070 | -0.2295 | No | ||
| 3 | TCAP | 1423145_a_at | 9749 | 0.009 | -0.4087 | No | ||
| 4 | TMOD1 | 1419863_at 1422754_at | 9806 | 0.008 | -0.4098 | No | ||
| 5 | TNNC1 | 1418370_at | 10957 | -0.007 | -0.4609 | No | ||
| 6 | MYL3 | 1427768_s_at 1427769_x_at 1428266_at | 14496 | -0.057 | -0.6116 | No | ||
| 7 | DES | 1426731_at | 15858 | -0.080 | -0.6586 | No | ||
| 8 | TNNI3 | 1422536_at | 17714 | -0.124 | -0.7200 | No | ||
| 9 | MYBPC2 | 1455736_at | 19454 | -0.194 | -0.7628 | Yes | ||
| 10 | TPM1 | 1423049_a_at 1423721_at 1447713_at 1456623_at | 20990 | -0.401 | -0.7576 | Yes | ||
| 11 | MYH6 | 1417729_at 1448826_at 1458850_at | 21360 | -0.596 | -0.6624 | Yes | ||
| 12 | DMD | 1417307_at 1430320_at 1446156_at 1448665_at 1457022_at | 21554 | -0.797 | -0.5215 | Yes | ||
| 13 | VIM | 1438118_x_at 1450641_at 1456292_a_at | 21782 | -1.421 | -0.2651 | Yes | ||
| 14 | TNNT2 | 1418726_a_at 1424967_x_at 1440424_at | 21786 | -1.448 | 0.0068 | Yes |