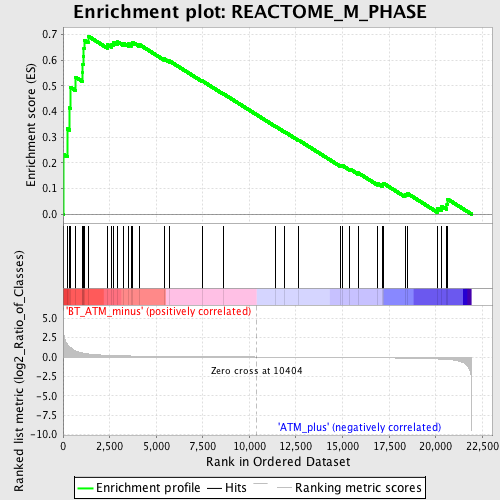
Profile of the Running ES Score & Positions of GeneSet Members on the Rank Ordered List
| Dataset | Set_02_BT_ATM_minus_versus_ATM_plus.phenotype_BT_ATM_minus_versus_ATM_plus.cls #BT_ATM_minus_versus_ATM_plus.phenotype_BT_ATM_minus_versus_ATM_plus.cls #BT_ATM_minus_versus_ATM_plus_repos |
| Phenotype | phenotype_BT_ATM_minus_versus_ATM_plus.cls#BT_ATM_minus_versus_ATM_plus_repos |
| Upregulated in class | BT_ATM_minus |
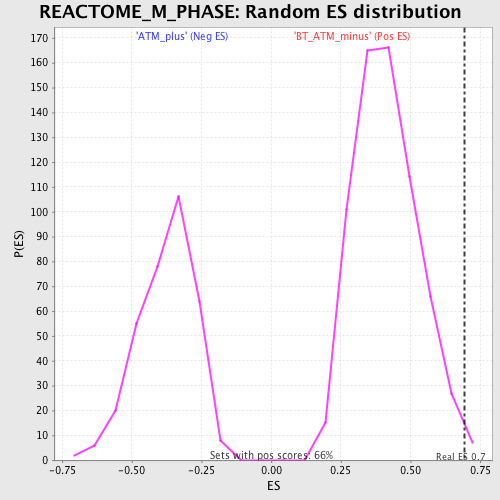
| GeneSet | REACTOME_M_PHASE |
| Enrichment Score (ES) | 0.69309807 |
| Normalized Enrichment Score (NES) | 1.6769515 |
| Nominal p-value | 0.0075642965 |
| FDR q-value | 0.7495919 |
| FWER p-Value | 0.908 |
| PROBE | DESCRIPTION (from dataset) | GENE SYMBOL | GENE_TITLE | RANK IN GENE LIST | RANK METRIC SCORE | RUNNING ES | CORE ENRICHMENT | |
|---|---|---|---|---|---|---|---|---|
| 1 | CENPA | 1441864_x_at 1444416_at 1450842_a_at | 24 | 3.525 | 0.2321 | Yes | ||
| 2 | BUB1B | 1416961_at 1447362_at 1447363_s_at | 222 | 1.655 | 0.3326 | Yes | ||
| 3 | ERCC6L | 1424766_at 1444024_at | 355 | 1.317 | 0.4137 | Yes | ||
| 4 | SGOL1 | 1418919_at 1439510_at | 388 | 1.239 | 0.4941 | Yes | ||
| 5 | MAPRE1 | 1422764_at 1422765_at 1428819_at 1428820_at 1450740_a_at | 660 | 0.789 | 0.5339 | Yes | ||
| 6 | KIF23 | 1450827_at 1453748_a_at 1455990_at | 1051 | 0.512 | 0.5500 | Yes | ||
| 7 | CENPC1 | 1420441_at | 1059 | 0.509 | 0.5833 | Yes | ||
| 8 | STAG2 | 1421849_at 1450396_at | 1081 | 0.498 | 0.6153 | Yes | ||
| 9 | KNTC1 | 1435575_at | 1115 | 0.486 | 0.6459 | Yes | ||
| 10 | ZWINT | 1423724_at 1427539_a_at 1427540_at 1429786_a_at 1429787_x_at 1444717_at 1455382_at | 1137 | 0.476 | 0.6764 | Yes | ||
| 11 | BUB1 | 1424046_at 1438571_at | 1346 | 0.396 | 0.6931 | Yes | ||
| 12 | RANBP2 | 1422621_at 1440104_at 1445883_at 1450690_at | 2397 | 0.213 | 0.6592 | No | ||
| 13 | KIF2A | 1432072_at 1450052_at 1450053_at 1452499_a_at 1454107_a_at | 2616 | 0.189 | 0.6618 | No | ||
| 14 | TAOK1 | 1424657_at 1424658_at 1426357_at 1426358_at 1444385_at 1455432_at 1456975_at 1459770_at | 2705 | 0.182 | 0.6698 | No | ||
| 15 | CDC20 | 1416664_at 1439377_x_at 1439394_x_at | 2928 | 0.166 | 0.6706 | No | ||
| 16 | SMC1A | 1417830_at 1417831_at 1417832_at | 3258 | 0.147 | 0.6653 | No | ||
| 17 | MAD2L1 | 1422460_at | 3510 | 0.135 | 0.6628 | No | ||
| 18 | PAFAH1B1 | 1417086_at 1427703_at 1439656_at 1441404_at 1444125_at 1448578_at 1456947_at 1460199_a_at | 3694 | 0.127 | 0.6628 | No | ||
| 19 | MLF1IP | 1428518_at 1452816_at | 3729 | 0.126 | 0.6696 | No | ||
| 20 | NUP160 | 1418530_at 1444892_at | 4123 | 0.111 | 0.6590 | No | ||
| 21 | CKAP5 | 1430647_at 1437349_at 1442271_at | 5420 | 0.078 | 0.6050 | No | ||
| 22 | PLK1 | 1443408_at 1448191_at 1459616_at | 5709 | 0.072 | 0.5966 | No | ||
| 23 | XPO1 | 1418442_at 1418443_at 1448070_at | 7471 | 0.041 | 0.5188 | No | ||
| 24 | NUP37 | 1423969_at | 8596 | 0.024 | 0.4691 | No | ||
| 25 | BIRC5 | 1424278_a_at | 11382 | -0.013 | 0.3427 | No | ||
| 26 | CLASP2 | 1424836_a_at 1427328_a_at 1429976_at 1440802_at 1441726_at 1443320_at 1456911_at | 11911 | -0.019 | 0.3199 | No | ||
| 27 | SGOL2 | 1437370_at | 12652 | -0.029 | 0.2881 | No | ||
| 28 | KIF2B | 1429333_at | 14897 | -0.063 | 0.1898 | No | ||
| 29 | KIF20A | 1449207_a_at | 14996 | -0.065 | 0.1896 | No | ||
| 30 | RANGAP1 | 1423749_s_at 1444581_at 1451092_a_at | 15400 | -0.072 | 0.1759 | No | ||
| 31 | CDCA8 | 1428480_at 1428481_s_at 1436847_s_at | 15851 | -0.080 | 0.1606 | No | ||
| 32 | NUP107 | 1426751_s_at | 16886 | -0.102 | 0.1202 | No | ||
| 33 | RAD21 | 1416161_at 1416162_at 1455938_x_at | 17142 | -0.109 | 0.1157 | No | ||
| 34 | CENPE | 1435005_at 1439040_at | 17186 | -0.110 | 0.1210 | No | ||
| 35 | NUP43 | 1432187_at 1432188_s_at | 18361 | -0.144 | 0.0769 | No | ||
| 36 | PMF1 | 1416707_a_at 1438173_x_at | 18473 | -0.148 | 0.0816 | No | ||
| 37 | PPP1CC | 1440594_at | 20091 | -0.245 | 0.0240 | No | ||
| 38 | BUB3 | 1416815_s_at 1448058_s_at 1448473_at 1459104_at 1459918_at | 20317 | -0.272 | 0.0317 | No | ||
| 39 | ZW10 | 1424891_a_at 1431747_at 1445206_at | 20611 | -0.314 | 0.0391 | No | ||
| 40 | CLASP1 | 1427353_at 1452265_at 1459233_at 1460102_at | 20656 | -0.322 | 0.0584 | No |