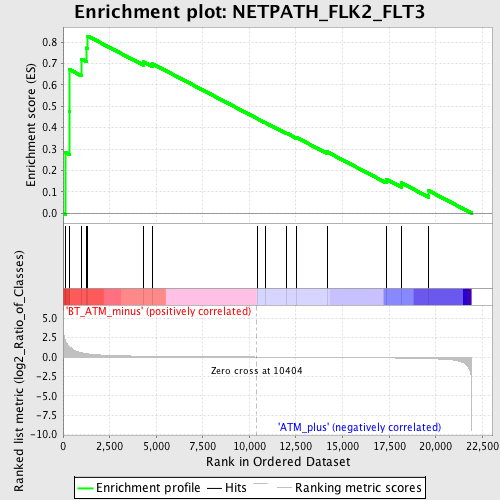
Profile of the Running ES Score & Positions of GeneSet Members on the Rank Ordered List
| Dataset | Set_02_BT_ATM_minus_versus_ATM_plus.phenotype_BT_ATM_minus_versus_ATM_plus.cls #BT_ATM_minus_versus_ATM_plus.phenotype_BT_ATM_minus_versus_ATM_plus.cls #BT_ATM_minus_versus_ATM_plus_repos |
| Phenotype | phenotype_BT_ATM_minus_versus_ATM_plus.cls#BT_ATM_minus_versus_ATM_plus_repos |
| Upregulated in class | BT_ATM_minus |
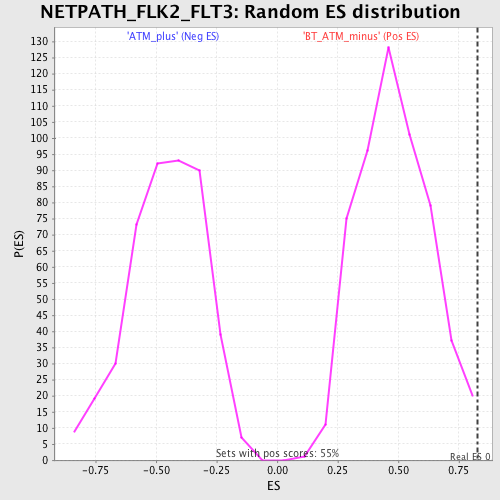
| GeneSet | NETPATH_FLK2_FLT3 |
| Enrichment Score (ES) | 0.8279603 |
| Normalized Enrichment Score (NES) | 1.7009902 |
| Nominal p-value | 0.0018248175 |
| FDR q-value | 0.75207764 |
| FWER p-Value | 0.806 |
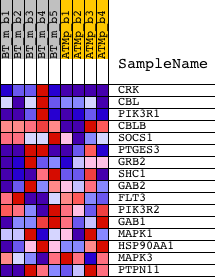
| PROBE | DESCRIPTION (from dataset) | GENE SYMBOL | GENE_TITLE | RANK IN GENE LIST | RANK METRIC SCORE | RUNNING ES | CORE ENRICHMENT | |
|---|---|---|---|---|---|---|---|---|
| 1 | CRK | 1416201_at 1425855_a_at 1436835_at 1448248_at 1460176_at | 136 | 1.966 | 0.2827 | Yes | ||
| 2 | CBL | 1434829_at 1446608_at 1450457_at 1455886_at | 334 | 1.363 | 0.4739 | Yes | ||
| 3 | PIK3R1 | 1425514_at 1425515_at 1438682_at 1444591_at 1451737_at | 343 | 1.346 | 0.6714 | Yes | ||
| 4 | CBLB | 1437304_at 1455082_at 1458469_at | 999 | 0.538 | 0.7205 | Yes | ||
| 5 | SOCS1 | 1440047_at 1450446_a_at | 1254 | 0.432 | 0.7725 | Yes | ||
| 6 | PTGES3 | 1417998_at 1460221_at | 1328 | 0.400 | 0.8280 | Yes | ||
| 7 | GRB2 | 1418508_a_at 1449111_a_at | 4312 | 0.105 | 0.7073 | No | ||
| 8 | SHC1 | 1422853_at 1422854_at | 4792 | 0.092 | 0.6990 | No | ||
| 9 | GAB2 | 1419829_a_at 1420785_at 1439786_at 1446860_at | 10440 | -0.000 | 0.4414 | No | ||
| 10 | FLT3 | 1419538_at | 10849 | -0.006 | 0.4237 | No | ||
| 11 | PIK3R2 | 1418463_at | 12012 | -0.021 | 0.3737 | No | ||
| 12 | GAB1 | 1417693_a_at 1417694_at 1448814_at | 12538 | -0.028 | 0.3538 | No | ||
| 13 | MAPK1 | 1419568_at 1426585_s_at 1442876_at 1453104_at | 14178 | -0.052 | 0.2866 | No | ||
| 14 | HSP90AA1 | 1426645_at 1437497_a_at 1438902_a_at 1455078_at | 17352 | -0.114 | 0.1586 | No | ||
| 15 | MAPK3 | 1427060_at | 18157 | -0.138 | 0.1421 | No | ||
| 16 | PTPN11 | 1421196_at 1427699_a_at 1451225_at | 19624 | -0.205 | 0.1054 | No |