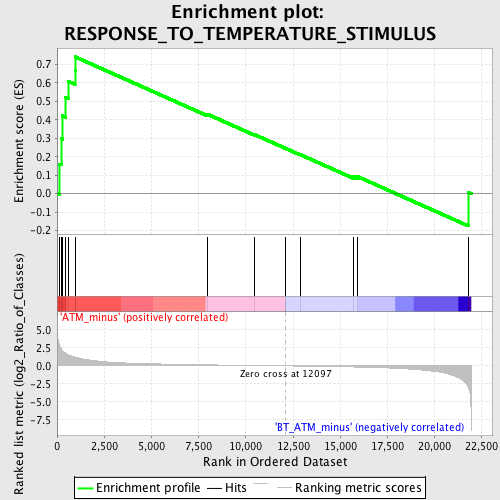
Profile of the Running ES Score & Positions of GeneSet Members on the Rank Ordered List
| Dataset | Set_02_ATM_minus_versus_BT_ATM_minus.phenotype_ATM_minus_versus_BT_ATM_minus.cls #ATM_minus_versus_BT_ATM_minus.phenotype_ATM_minus_versus_BT_ATM_minus.cls #ATM_minus_versus_BT_ATM_minus_repos |
| Phenotype | phenotype_ATM_minus_versus_BT_ATM_minus.cls#ATM_minus_versus_BT_ATM_minus_repos |
| Upregulated in class | ATM_minus |
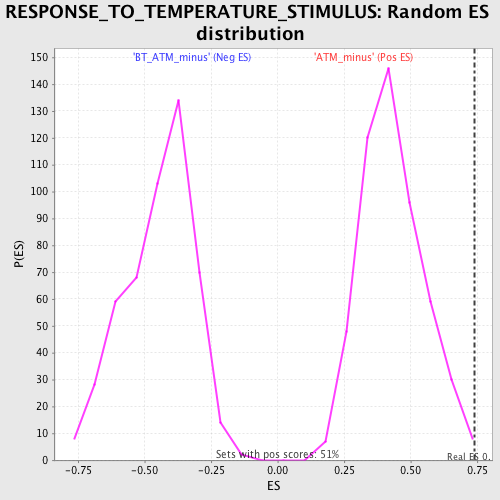
| GeneSet | RESPONSE_TO_TEMPERATURE_STIMULUS |
| Enrichment Score (ES) | 0.7410811 |
| Normalized Enrichment Score (NES) | 1.7188007 |
| Nominal p-value | 0.0038910506 |
| FDR q-value | 0.2633489 |
| FWER p-Value | 0.888 |
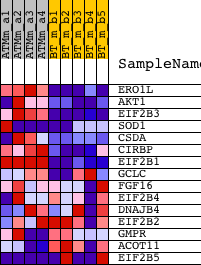
| PROBE | DESCRIPTION (from dataset) | GENE SYMBOL | GENE_TITLE | RANK IN GENE LIST | RANK METRIC SCORE | RUNNING ES | CORE ENRICHMENT | |
|---|---|---|---|---|---|---|---|---|
| 1 | ERO1L | 1419029_at 1419030_at 1449324_at | 145 | 2.709 | 0.1597 | Yes | ||
| 2 | AKT1 | 1416657_at 1425711_a_at 1440950_at 1442759_at | 222 | 2.308 | 0.2979 | Yes | ||
| 3 | EIF2B3 | 1434524_at | 281 | 2.058 | 0.4216 | Yes | ||
| 4 | SOD1 | 1435304_at 1440222_at 1440896_at 1451124_at 1459976_s_at | 441 | 1.745 | 0.5215 | Yes | ||
| 5 | CSDA | 1435800_a_at 1451012_a_at | 609 | 1.530 | 0.6078 | Yes | ||
| 6 | CIRBP | 1416332_at | 949 | 1.217 | 0.6670 | Yes | ||
| 7 | EIF2B1 | 1460730_at | 957 | 1.211 | 0.7411 | Yes | ||
| 8 | GCLC | 1424296_at | 7979 | 0.141 | 0.4294 | No | ||
| 9 | FGF16 | 1420806_at | 10446 | 0.056 | 0.3203 | No | ||
| 10 | EIF2B4 | 1449940_a_at | 12095 | 0.000 | 0.2452 | No | ||
| 11 | DNAJB4 | 1431734_a_at 1439524_at 1443611_at 1451177_at | 12112 | -0.001 | 0.2445 | No | ||
| 12 | EIF2B2 | 1434538_x_at 1437428_x_at 1451136_a_at | 12879 | -0.029 | 0.2113 | No | ||
| 13 | GMPR | 1448530_at | 15695 | -0.152 | 0.0923 | No | ||
| 14 | ACOT11 | 1425667_at 1429267_at | 15923 | -0.165 | 0.0921 | No | ||
| 15 | EIF2B5 | 1433886_at 1445908_at | 21782 | -2.966 | 0.0069 | No |