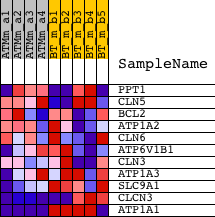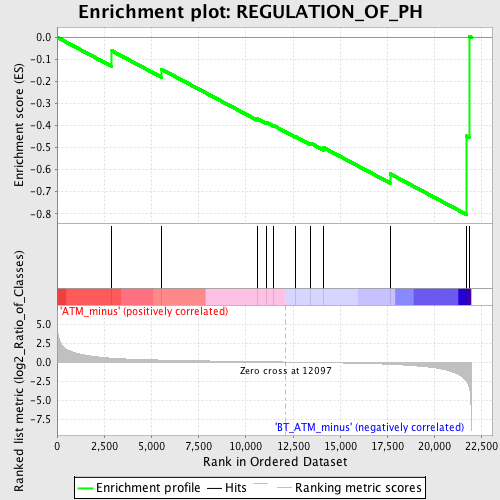
Profile of the Running ES Score & Positions of GeneSet Members on the Rank Ordered List
| Dataset | Set_02_ATM_minus_versus_BT_ATM_minus.phenotype_ATM_minus_versus_BT_ATM_minus.cls #ATM_minus_versus_BT_ATM_minus.phenotype_ATM_minus_versus_BT_ATM_minus.cls #ATM_minus_versus_BT_ATM_minus_repos |
| Phenotype | phenotype_ATM_minus_versus_BT_ATM_minus.cls#ATM_minus_versus_BT_ATM_minus_repos |
| Upregulated in class | BT_ATM_minus |
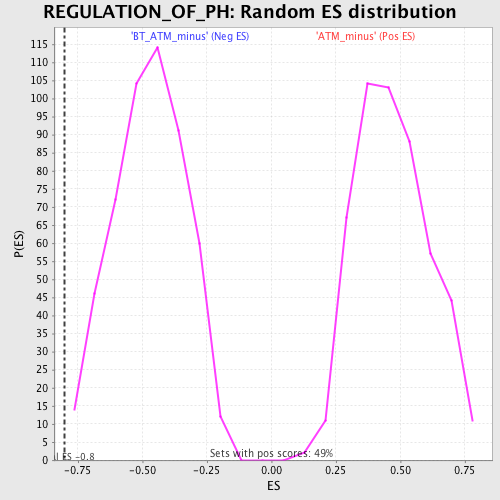
| GeneSet | REGULATION_OF_PH |
| Enrichment Score (ES) | -0.803408 |
| Normalized Enrichment Score (NES) | -1.7006232 |
| Nominal p-value | 0.0019493178 |
| FDR q-value | 0.2852137 |
| FWER p-Value | 0.922 |
| PROBE | DESCRIPTION (from dataset) | GENE SYMBOL | GENE_TITLE | RANK IN GENE LIST | RANK METRIC SCORE | RUNNING ES | CORE ENRICHMENT | |
|---|---|---|---|---|---|---|---|---|
| 1 | PPT1 | 1420015_s_at 1420016_at 1422467_at 1422468_at 1444884_at | 2903 | 0.502 | -0.0615 | No | ||
| 2 | CLN5 | 1426886_at | 5540 | 0.256 | -0.1456 | No | ||
| 3 | BCL2 | 1422938_at 1427818_at 1437122_at 1440770_at 1443837_x_at 1457687_at | 10594 | 0.051 | -0.3690 | No | ||
| 4 | ATP1A2 | 1427465_at 1434893_at 1443823_s_at 1452308_a_at 1455136_at | 11069 | 0.035 | -0.3857 | No | ||
| 5 | CLN6 | 1454837_at | 11470 | 0.021 | -0.4009 | No | ||
| 6 | ATP6V1B1 | 1419373_at | 12636 | -0.020 | -0.4512 | No | ||
| 7 | CLN3 | 1417551_at 1457789_at | 13438 | -0.050 | -0.4806 | No | ||
| 8 | ATP1A3 | 1424856_at 1427481_a_at | 14115 | -0.078 | -0.5005 | No | ||
| 9 | SLC9A1 | 1417397_at | 17632 | -0.297 | -0.6190 | Yes | ||
| 10 | CLCN3 | 1416610_a_at 1433486_at 1433487_at 1438366_x_at | 21677 | -2.522 | -0.4474 | Yes | ||
| 11 | ATP1A1 | 1423653_at 1435919_at 1435920_x_at 1451071_a_at 1458868_at | 21817 | -3.252 | 0.0053 | Yes |