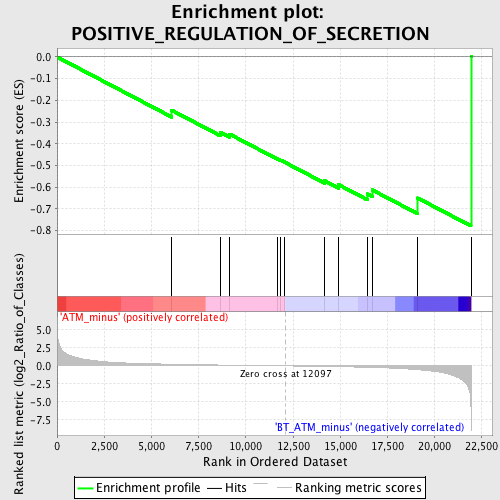
Profile of the Running ES Score & Positions of GeneSet Members on the Rank Ordered List
| Dataset | Set_02_ATM_minus_versus_BT_ATM_minus.phenotype_ATM_minus_versus_BT_ATM_minus.cls #ATM_minus_versus_BT_ATM_minus.phenotype_ATM_minus_versus_BT_ATM_minus.cls #ATM_minus_versus_BT_ATM_minus_repos |
| Phenotype | phenotype_ATM_minus_versus_BT_ATM_minus.cls#ATM_minus_versus_BT_ATM_minus_repos |
| Upregulated in class | BT_ATM_minus |
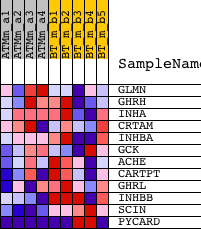
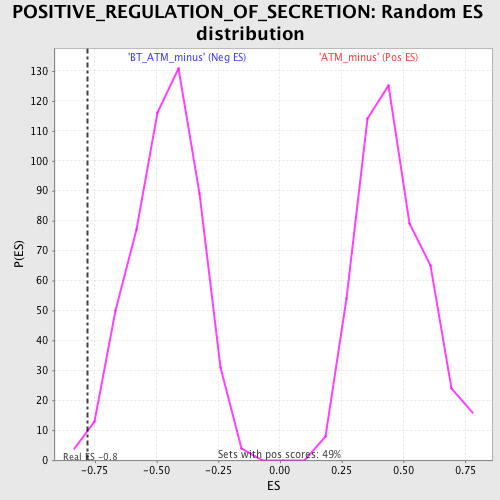
| GeneSet | POSITIVE_REGULATION_OF_SECRETION |
| Enrichment Score (ES) | -0.7788628 |
| Normalized Enrichment Score (NES) | -1.6787778 |
| Nominal p-value | 0.0077669905 |
| FDR q-value | 0.34047595 |
| FWER p-Value | 0.968 |
| PROBE | DESCRIPTION (from dataset) | GENE SYMBOL | GENE_TITLE | RANK IN GENE LIST | RANK METRIC SCORE | RUNNING ES | CORE ENRICHMENT | |
|---|---|---|---|---|---|---|---|---|
| 1 | GLMN | 1418839_at | 6071 | 0.226 | -0.2457 | No | ||
| 2 | GHRH | 1419634_a_at | 8647 | 0.117 | -0.3471 | No | ||
| 3 | INHA | 1422728_at | 9142 | 0.100 | -0.3559 | No | ||
| 4 | CRTAM | 1449903_at | 11689 | 0.014 | -0.4701 | No | ||
| 5 | INHBA | 1422053_at 1458291_at | 11826 | 0.009 | -0.4750 | No | ||
| 6 | GCK | 1419146_a_at 1425303_at | 12044 | 0.002 | -0.4847 | No | ||
| 7 | ACHE | 1422635_at | 14170 | -0.080 | -0.5706 | No | ||
| 8 | CARTPT | 1422825_at | 14909 | -0.113 | -0.5887 | No | ||
| 9 | GHRL | 1448980_at | 16443 | -0.198 | -0.6313 | No | ||
| 10 | INHBB | 1426858_at 1426859_at | 16688 | -0.216 | -0.6127 | No | ||
| 11 | SCIN | 1450276_a_at | 19091 | -0.525 | -0.6499 | Yes | ||
| 12 | PYCARD | 1417346_at 1417347_at 1446926_at | 21920 | -5.654 | 0.0006 | Yes |