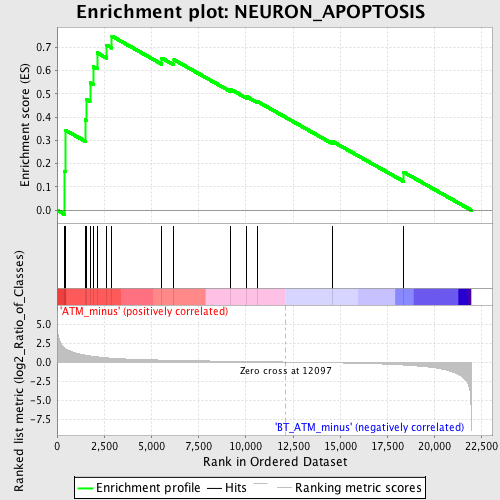
Profile of the Running ES Score & Positions of GeneSet Members on the Rank Ordered List
| Dataset | Set_02_ATM_minus_versus_BT_ATM_minus.phenotype_ATM_minus_versus_BT_ATM_minus.cls #ATM_minus_versus_BT_ATM_minus.phenotype_ATM_minus_versus_BT_ATM_minus.cls #ATM_minus_versus_BT_ATM_minus_repos |
| Phenotype | phenotype_ATM_minus_versus_BT_ATM_minus.cls#ATM_minus_versus_BT_ATM_minus_repos |
| Upregulated in class | ATM_minus |
| GeneSet | NEURON_APOPTOSIS |
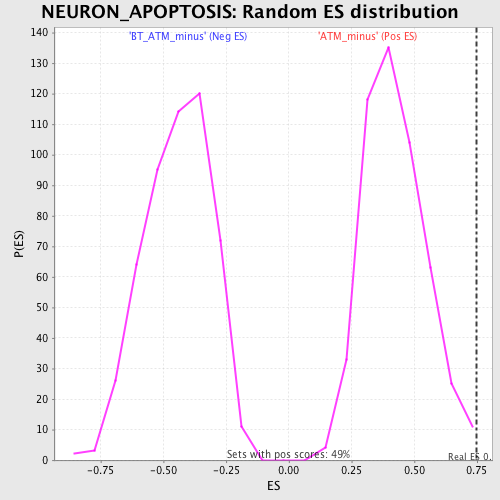
| Enrichment Score (ES) | 0.7472695 |
| Normalized Enrichment Score (NES) | 1.7737024 |
| Nominal p-value | 0.006085193 |
| FDR q-value | 0.19509423 |
| FWER p-Value | 0.629 |
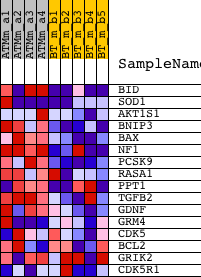
| PROBE | DESCRIPTION (from dataset) | GENE SYMBOL | GENE_TITLE | RANK IN GENE LIST | RANK METRIC SCORE | RUNNING ES | CORE ENRICHMENT | |
|---|---|---|---|---|---|---|---|---|
| 1 | BID | 1417045_at 1447873_x_at 1448560_at | 401 | 1.814 | 0.1670 | Yes | ||
| 2 | SOD1 | 1435304_at 1440222_at 1440896_at 1451124_at 1459976_s_at | 441 | 1.745 | 0.3435 | Yes | ||
| 3 | AKT1S1 | 1428158_at 1437736_at 1452684_at | 1487 | 0.901 | 0.3879 | Yes | ||
| 4 | BNIP3 | 1422470_at | 1534 | 0.882 | 0.4760 | Yes | ||
| 5 | BAX | 1416837_at | 1743 | 0.798 | 0.5480 | Yes | ||
| 6 | NF1 | 1438067_at 1441523_at 1443097_at 1452525_a_at | 1915 | 0.738 | 0.6156 | Yes | ||
| 7 | PCSK9 | 1437453_s_at | 2119 | 0.678 | 0.6756 | Yes | ||
| 8 | RASA1 | 1426476_at 1426477_at 1426478_at 1438998_at | 2630 | 0.549 | 0.7084 | Yes | ||
| 9 | PPT1 | 1420015_s_at 1420016_at 1422467_at 1422468_at 1444884_at | 2903 | 0.502 | 0.7473 | Yes | ||
| 10 | TGFB2 | 1423250_a_at 1438303_at 1446141_at 1450922_a_at 1450923_at | 5545 | 0.256 | 0.6529 | No | ||
| 11 | GDNF | 1419080_at | 6188 | 0.220 | 0.6461 | No | ||
| 12 | GRM4 | 1457299_at | 9181 | 0.098 | 0.5196 | No | ||
| 13 | CDK5 | 1422590_at 1450674_at | 10047 | 0.069 | 0.4872 | No | ||
| 14 | BCL2 | 1422938_at 1427818_at 1437122_at 1440770_at 1443837_x_at 1457687_at | 10594 | 0.051 | 0.4674 | No | ||
| 15 | GRIK2 | 1425790_a_at 1439286_at 1440602_at 1445090_at 1457683_at | 14571 | -0.098 | 0.2960 | No | ||
| 16 | CDK5R1 | 1421123_at 1421124_at 1433450_at 1433451_at | 18352 | -0.390 | 0.1634 | No |