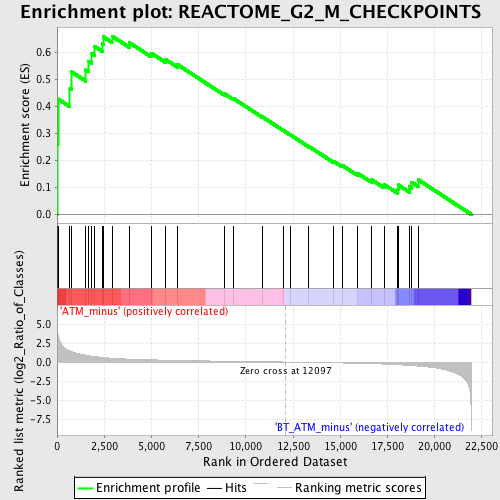
Profile of the Running ES Score & Positions of GeneSet Members on the Rank Ordered List
| Dataset | Set_02_ATM_minus_versus_BT_ATM_minus.phenotype_ATM_minus_versus_BT_ATM_minus.cls #ATM_minus_versus_BT_ATM_minus.phenotype_ATM_minus_versus_BT_ATM_minus.cls #ATM_minus_versus_BT_ATM_minus_repos |
| Phenotype | phenotype_ATM_minus_versus_BT_ATM_minus.cls#ATM_minus_versus_BT_ATM_minus_repos |
| Upregulated in class | ATM_minus |
| GeneSet | REACTOME_G2_M_CHECKPOINTS |
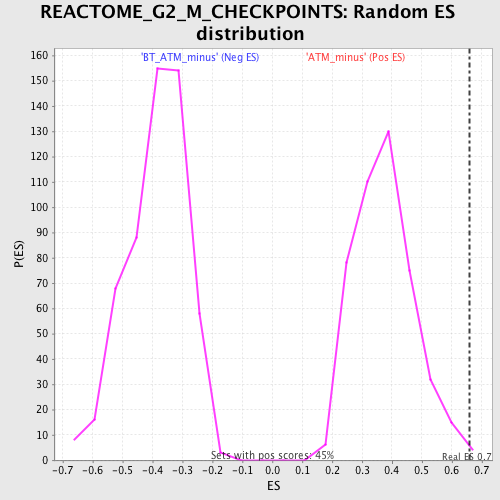
| Enrichment Score (ES) | 0.6601377 |
| Normalized Enrichment Score (NES) | 1.7592624 |
| Nominal p-value | 0.0044444446 |
| FDR q-value | 0.04102245 |
| FWER p-Value | 0.512 |
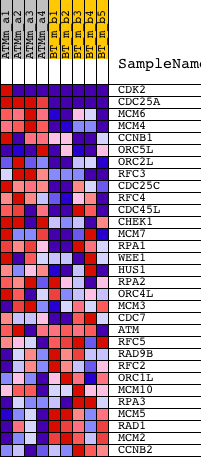
| PROBE | DESCRIPTION (from dataset) | GENE SYMBOL | GENE_TITLE | RANK IN GENE LIST | RANK METRIC SCORE | RUNNING ES | CORE ENRICHMENT | |
|---|---|---|---|---|---|---|---|---|
| 1 | CDK2 | 1416873_a_at 1447617_at | 8 | 5.536 | 0.2592 | Yes | ||
| 2 | CDC25A | 1417131_at 1417132_at 1445995_at | 47 | 3.621 | 0.4273 | Yes | ||
| 3 | MCM6 | 1416251_at 1438852_x_at 1447756_x_at | 679 | 1.462 | 0.4671 | Yes | ||
| 4 | MCM4 | 1416214_at 1436708_x_at | 761 | 1.378 | 0.5280 | Yes | ||
| 5 | CCNB1 | 1419943_s_at 1419944_at | 1521 | 0.886 | 0.5349 | Yes | ||
| 6 | ORC5L | 1415830_at 1441601_at | 1672 | 0.832 | 0.5670 | Yes | ||
| 7 | ORC2L | 1418225_at 1418226_at 1418227_at | 1843 | 0.762 | 0.5950 | Yes | ||
| 8 | RFC3 | 1423700_at 1432538_a_at | 1985 | 0.719 | 0.6223 | Yes | ||
| 9 | CDC25C | 1422252_a_at | 2391 | 0.607 | 0.6323 | Yes | ||
| 10 | RFC4 | 1424321_at 1438161_s_at | 2443 | 0.593 | 0.6578 | Yes | ||
| 11 | CDC45L | 1416575_at 1457838_at | 2907 | 0.501 | 0.6601 | Yes | ||
| 12 | CHEK1 | 1420031_at 1420032_at 1439208_at 1449708_s_at 1450677_at | 3820 | 0.380 | 0.6363 | No | ||
| 13 | MCM7 | 1416030_a_at 1416031_s_at 1438320_s_at | 4985 | 0.292 | 0.5969 | No | ||
| 14 | RPA1 | 1423293_at 1437309_a_at 1441240_at | 5735 | 0.245 | 0.5742 | No | ||
| 15 | WEE1 | 1416773_at 1416774_at | 6394 | 0.210 | 0.5540 | No | ||
| 16 | HUS1 | 1418308_at 1425366_a_at | 8853 | 0.110 | 0.4469 | No | ||
| 17 | RPA2 | 1416433_at 1454011_a_at | 9314 | 0.093 | 0.4303 | No | ||
| 18 | ORC4L | 1423336_at 1423337_at 1431172_at 1453804_a_at | 10870 | 0.041 | 0.3612 | No | ||
| 19 | MCM3 | 1420029_at 1426653_at | 11978 | 0.004 | 0.3109 | No | ||
| 20 | CDC7 | 1426002_a_at 1426021_a_at | 12379 | -0.011 | 0.2931 | No | ||
| 21 | ATM | 1421205_at 1428830_at | 13337 | -0.046 | 0.2516 | No | ||
| 22 | RFC5 | 1452917_at | 14645 | -0.102 | 0.1967 | No | ||
| 23 | RAD9B | 1425800_at 1439955_at | 15104 | -0.121 | 0.1814 | No | ||
| 24 | RFC2 | 1417503_at 1457638_x_at 1457669_x_at | 15920 | -0.165 | 0.1520 | No | ||
| 25 | ORC1L | 1422663_at 1443172_at | 16631 | -0.211 | 0.1295 | No | ||
| 26 | MCM10 | 1433407_at 1433408_a_at 1454244_at | 17316 | -0.266 | 0.1107 | No | ||
| 27 | RPA3 | 1448938_at | 18042 | -0.345 | 0.0938 | No | ||
| 28 | MCM5 | 1415945_at 1436808_x_at | 18068 | -0.348 | 0.1090 | No | ||
| 29 | RAD1 | 1448414_at | 18652 | -0.439 | 0.1029 | No | ||
| 30 | MCM2 | 1434079_s_at 1448777_at | 18785 | -0.465 | 0.1187 | No | ||
| 31 | CCNB2 | 1450920_at | 19125 | -0.534 | 0.1282 | No |