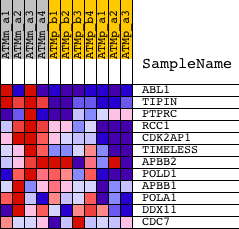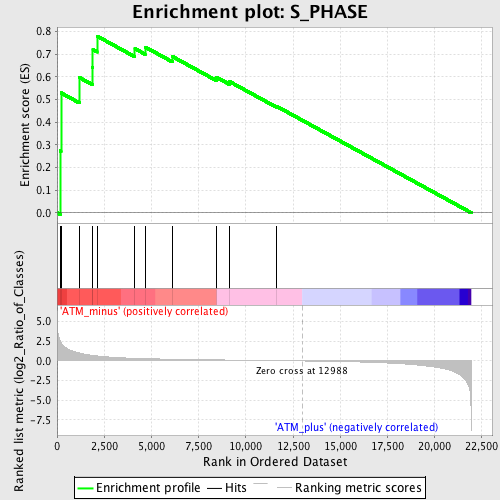
Profile of the Running ES Score & Positions of GeneSet Members on the Rank Ordered List
| Dataset | Set_02_ATM_minus_versus_ATM_plus.phenotype_ATM_minus_versus_ATM_plus.cls #ATM_minus_versus_ATM_plus.phenotype_ATM_minus_versus_ATM_plus.cls #ATM_minus_versus_ATM_plus_repos |
| Phenotype | phenotype_ATM_minus_versus_ATM_plus.cls#ATM_minus_versus_ATM_plus_repos |
| Upregulated in class | ATM_minus |
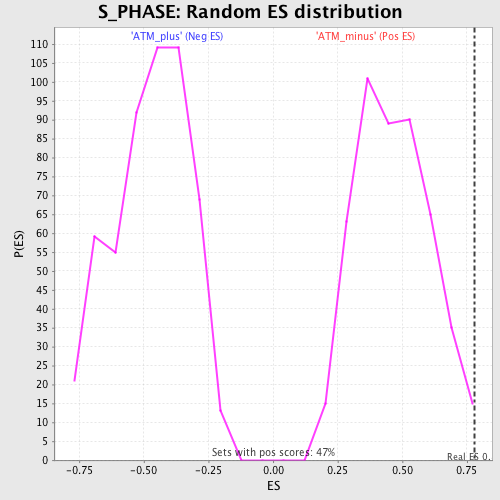
| GeneSet | S_PHASE |
| Enrichment Score (ES) | 0.7799263 |
| Normalized Enrichment Score (NES) | 1.6745797 |
| Nominal p-value | 0.01268499 |
| FDR q-value | 0.18117698 |
| FWER p-Value | 0.945 |
| PROBE | DESCRIPTION (from dataset) | GENE SYMBOL | GENE_TITLE | RANK IN GENE LIST | RANK METRIC SCORE | RUNNING ES | CORE ENRICHMENT | |
|---|---|---|---|---|---|---|---|---|
| 1 | ABL1 | 1423999_at 1441291_at 1444134_at 1445153_at | 163 | 2.553 | 0.2740 | Yes | ||
| 2 | TIPIN | 1426612_at | 207 | 2.334 | 0.5293 | Yes | ||
| 3 | PTPRC | 1422124_a_at 1440165_at | 1172 | 1.016 | 0.5973 | Yes | ||
| 4 | RCC1 | 1416962_at | 1882 | 0.707 | 0.6430 | Yes | ||
| 5 | CDK2AP1 | 1426885_a_at 1435509_x_at 1456314_x_at | 1899 | 0.702 | 0.7196 | Yes | ||
| 6 | TIMELESS | 1417586_at 1417587_at | 2115 | 0.637 | 0.7799 | Yes | ||
| 7 | APBB2 | 1426719_at 1426720_at 1440135_at 1446481_at 1452342_at | 4123 | 0.327 | 0.7244 | No | ||
| 8 | POLD1 | 1448187_at 1456055_x_at | 4661 | 0.290 | 0.7319 | No | ||
| 9 | APBB1 | 1423892_at 1423893_x_at | 6111 | 0.216 | 0.6896 | No | ||
| 10 | POLA1 | 1419397_at 1456285_at 1459319_at 1459963_at | 8446 | 0.135 | 0.5980 | No | ||
| 11 | DDX11 | 1438447_at 1441062_at | 9116 | 0.113 | 0.5800 | No | ||
| 12 | CDC7 | 1426002_a_at 1426021_a_at | 11602 | 0.042 | 0.4713 | No |