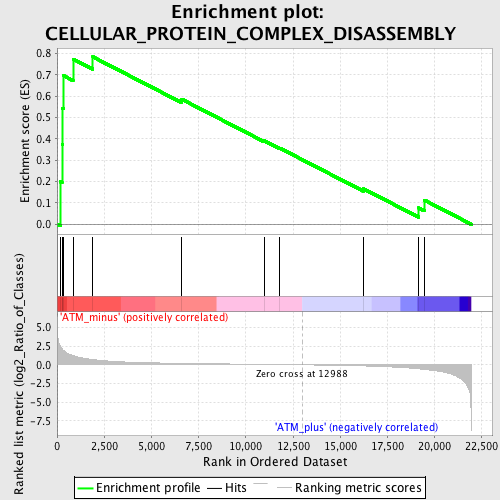
Profile of the Running ES Score & Positions of GeneSet Members on the Rank Ordered List
| Dataset | Set_02_ATM_minus_versus_ATM_plus.phenotype_ATM_minus_versus_ATM_plus.cls #ATM_minus_versus_ATM_plus.phenotype_ATM_minus_versus_ATM_plus.cls #ATM_minus_versus_ATM_plus_repos |
| Phenotype | phenotype_ATM_minus_versus_ATM_plus.cls#ATM_minus_versus_ATM_plus_repos |
| Upregulated in class | ATM_minus |
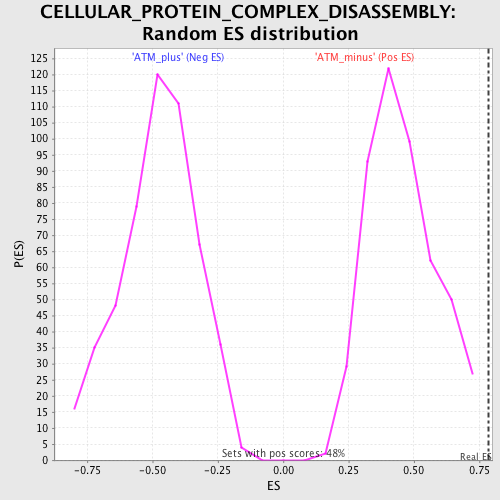
| GeneSet | CELLULAR_PROTEIN_COMPLEX_DISASSEMBLY |
| Enrichment Score (ES) | 0.78416 |
| Normalized Enrichment Score (NES) | 1.719034 |
| Nominal p-value | 0.0 |
| FDR q-value | 0.1715637 |
| FWER p-Value | 0.812 |
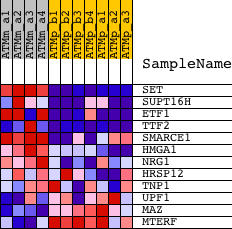
| PROBE | DESCRIPTION (from dataset) | GENE SYMBOL | GENE_TITLE | RANK IN GENE LIST | RANK METRIC SCORE | RUNNING ES | CORE ENRICHMENT | |
|---|---|---|---|---|---|---|---|---|
| 1 | SET | 1426853_at 1426854_a_at | 171 | 2.519 | 0.1995 | Yes | ||
| 2 | SUPT16H | 1419741_at 1449578_at 1456449_at | 263 | 2.147 | 0.3720 | Yes | ||
| 3 | ETF1 | 1420023_at 1420024_s_at 1424013_at 1440629_at 1451208_at | 277 | 2.102 | 0.5445 | Yes | ||
| 4 | TTF2 | 1428522_at 1447119_at 1452818_at | 354 | 1.875 | 0.6953 | Yes | ||
| 5 | SMARCE1 | 1422675_at 1422676_at 1430822_at | 847 | 1.229 | 0.7740 | Yes | ||
| 6 | HMGA1 | 1416184_s_at | 1893 | 0.703 | 0.7842 | Yes | ||
| 7 | NRG1 | 1456524_at | 6603 | 0.197 | 0.5855 | No | ||
| 8 | HRSP12 | 1419348_at 1428326_s_at | 10979 | 0.060 | 0.3909 | No | ||
| 9 | TNP1 | 1415924_at 1438632_x_at | 11791 | 0.037 | 0.3569 | No | ||
| 10 | UPF1 | 1419685_at | 16207 | -0.142 | 0.1672 | No | ||
| 11 | MAZ | 1427099_at | 19156 | -0.534 | 0.0767 | No | ||
| 12 | MTERF | 1429698_at | 19450 | -0.608 | 0.1133 | No |