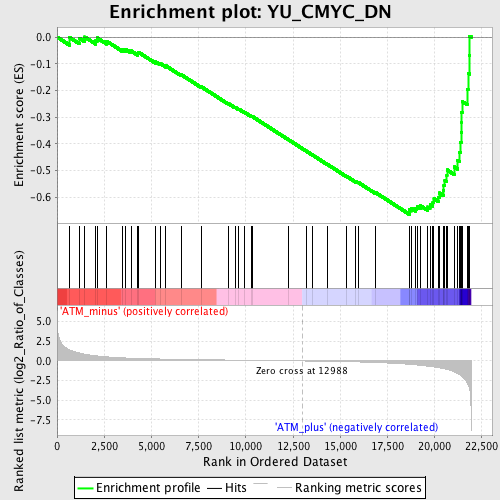
Profile of the Running ES Score & Positions of GeneSet Members on the Rank Ordered List
| Dataset | Set_02_ATM_minus_versus_ATM_plus.phenotype_ATM_minus_versus_ATM_plus.cls #ATM_minus_versus_ATM_plus.phenotype_ATM_minus_versus_ATM_plus.cls #ATM_minus_versus_ATM_plus_repos |
| Phenotype | phenotype_ATM_minus_versus_ATM_plus.cls#ATM_minus_versus_ATM_plus_repos |
| Upregulated in class | ATM_plus |
| GeneSet | YU_CMYC_DN |
| Enrichment Score (ES) | -0.6652945 |
| Normalized Enrichment Score (NES) | -1.8686557 |
| Nominal p-value | 0.0 |
| FDR q-value | 0.042207193 |
| FWER p-Value | 0.122 |
| PROBE | DESCRIPTION (from dataset) | GENE SYMBOL | GENE_TITLE | RANK IN GENE LIST | RANK METRIC SCORE | RUNNING ES | CORE ENRICHMENT | |
|---|---|---|---|---|---|---|---|---|
| 1 | BLK | 1422775_at | 661 | 1.404 | -0.0014 | No | ||
| 2 | PTPRC | 1422124_a_at 1440165_at | 1172 | 1.016 | -0.0039 | No | ||
| 3 | 5730420B22RIK | 1427050_at | 1463 | 0.862 | 0.0005 | No | ||
| 4 | PRKCB1 | 1423478_at 1438981_at 1443144_at 1459674_at 1460419_a_at | 2052 | 0.652 | -0.0130 | No | ||
| 5 | GBP4 | 1418392_a_at | 2116 | 0.636 | -0.0029 | No | ||
| 6 | GAD1 | 1416561_at 1416562_at | 2626 | 0.519 | -0.0155 | No | ||
| 7 | D4WSU132E | 1417321_at | 3474 | 0.390 | -0.0462 | No | ||
| 8 | UNC93B1 | 1423768_at | 3637 | 0.372 | -0.0460 | No | ||
| 9 | ARID3B | 1423526_at 1447626_x_at | 3918 | 0.344 | -0.0518 | No | ||
| 10 | IL10RA | 1437808_x_at 1448731_at 1456173_at | 4268 | 0.315 | -0.0612 | No | ||
| 11 | LAPTM5 | 1426025_s_at 1436905_x_at 1447742_at 1459841_x_at | 4311 | 0.313 | -0.0567 | No | ||
| 12 | SPIB | 1460407_at | 5209 | 0.259 | -0.0925 | No | ||
| 13 | MGST1 | 1415897_a_at 1415898_at | 5462 | 0.245 | -0.0989 | No | ||
| 14 | H2-AB1 | 1425477_x_at 1450648_s_at 1451721_a_at | 5757 | 0.232 | -0.1076 | No | ||
| 15 | GDI1 | 1447613_at 1451070_at | 6587 | 0.197 | -0.1415 | No | ||
| 16 | CTSH | 1418365_at 1443814_x_at | 7633 | 0.161 | -0.1860 | No | ||
| 17 | SSPN | 1417644_at 1417645_at | 9059 | 0.116 | -0.2487 | No | ||
| 18 | PLD4 | 1433678_at | 9433 | 0.105 | -0.2636 | No | ||
| 19 | MYO7A | 1421385_a_at | 9612 | 0.099 | -0.2697 | No | ||
| 20 | CD2 | 1418770_at | 9935 | 0.090 | -0.2826 | No | ||
| 21 | H2-DMB1 | 1418638_at 1443686_at 1443687_x_at | 10276 | 0.080 | -0.2965 | No | ||
| 22 | AW061234 | 1454984_at | 10325 | 0.078 | -0.2971 | No | ||
| 23 | IGH-1A | 1425385_a_at 1426196_at 1451632_a_at 1452535_at 1452538_at 1455530_at | 12246 | 0.023 | -0.3844 | No | ||
| 24 | RBMS1 | 1418703_at 1434005_at 1441437_at 1458578_at 1459968_at | 13184 | -0.007 | -0.4271 | No | ||
| 25 | CD74 | 1425519_a_at | 13521 | -0.018 | -0.4421 | No | ||
| 26 | OLFM1 | 1425784_a_at 1426562_a_at 1440115_at 1455796_x_at | 14298 | -0.047 | -0.4766 | No | ||
| 27 | PYGM | 1448602_at | 15344 | -0.093 | -0.5225 | No | ||
| 28 | SRPK3 | 1418798_s_at 1431825_at 1432139_at 1447806_s_at | 15827 | -0.118 | -0.5421 | No | ||
| 29 | ABCA1 | 1421839_at 1421840_at 1450392_at | 15940 | -0.124 | -0.5447 | No | ||
| 30 | IFI203 | 1419858_at 1425008_a_at 1426906_at 1442828_at 1448775_at 1451567_a_at 1452231_x_at | 16852 | -0.192 | -0.5824 | No | ||
| 31 | CD1D1 | 1449130_at 1449131_s_at | 18667 | -0.428 | -0.6565 | Yes | ||
| 32 | H2-EB1 | 1417025_at | 18670 | -0.428 | -0.6478 | Yes | ||
| 33 | IL4I1 | 1419192_at | 18767 | -0.448 | -0.6430 | Yes | ||
| 34 | MACF1 | 1428847_a_at 1428848_a_at 1439582_at | 18978 | -0.494 | -0.6425 | Yes | ||
| 35 | GGA2 | 1428141_at 1457955_at | 19059 | -0.513 | -0.6357 | Yes | ||
| 36 | CD37 | 1419206_at 1425736_at | 19242 | -0.557 | -0.6326 | Yes | ||
| 37 | MAP4K2 | 1428297_at 1434833_at 1450244_a_at | 19638 | -0.659 | -0.6371 | Yes | ||
| 38 | 1100001G20RIK | 1434484_at | 19750 | -0.692 | -0.6280 | Yes | ||
| 39 | KLF3 | 1421604_a_at 1429360_at 1431630_a_at 1441200_at 1442920_at 1454666_at | 19902 | -0.745 | -0.6196 | Yes | ||
| 40 | ACP5 | 1431609_a_at | 19958 | -0.764 | -0.6065 | Yes | ||
| 41 | ERO1LB | 1425705_a_at 1434714_at 1449948_at | 20205 | -0.850 | -0.6003 | Yes | ||
| 42 | MS4A1 | 1423226_at 1450912_at | 20249 | -0.868 | -0.5845 | Yes | ||
| 43 | H2-AA | 1435290_x_at 1438858_x_at 1443783_x_at | 20458 | -0.961 | -0.5743 | Yes | ||
| 44 | RGL2 | 1450688_at | 20483 | -0.974 | -0.5554 | Yes | ||
| 45 | 1110038D17RIK | 1428071_at | 20538 | -1.009 | -0.5372 | Yes | ||
| 46 | SIPA1 | 1416206_at | 20641 | -1.074 | -0.5199 | Yes | ||
| 47 | H2-OB | 1440837_at | 20650 | -1.081 | -0.4981 | Yes | ||
| 48 | HMHA1 | 1428242_at | 21029 | -1.394 | -0.4868 | Yes | ||
| 49 | SLFN2 | 1450165_at | 21215 | -1.608 | -0.4623 | Yes | ||
| 50 | GNS | 1433488_x_at 1433546_at 1446861_at | 21325 | -1.768 | -0.4311 | Yes | ||
| 51 | DGKA | 1418578_at | 21363 | -1.811 | -0.3956 | Yes | ||
| 52 | H2-DMA | 1422527_at 1459872_x_at | 21397 | -1.876 | -0.3587 | Yes | ||
| 53 | CMAH | 1421214_at 1428043_a_at 1440458_at 1440517_x_at 1447019_at 1447502_at | 21417 | -1.922 | -0.3202 | Yes | ||
| 54 | BTG1 | 1426083_a_at 1437455_a_at | 21424 | -1.930 | -0.2809 | Yes | ||
| 55 | ARHGEF1 | 1421164_a_at 1440403_at | 21451 | -1.983 | -0.2415 | Yes | ||
| 56 | KLF2 | 1448890_at | 21716 | -2.815 | -0.1958 | Yes | ||
| 57 | LTB | 1419135_at | 21767 | -3.034 | -0.1359 | Yes | ||
| 58 | EVL | 1434920_a_at 1440885_at 1445957_at 1450106_a_at 1456453_at 1458889_at | 21831 | -3.401 | -0.0691 | Yes | ||
| 59 | RAG1 | 1440574_at 1450680_at | 21853 | -3.599 | 0.0037 | Yes |

