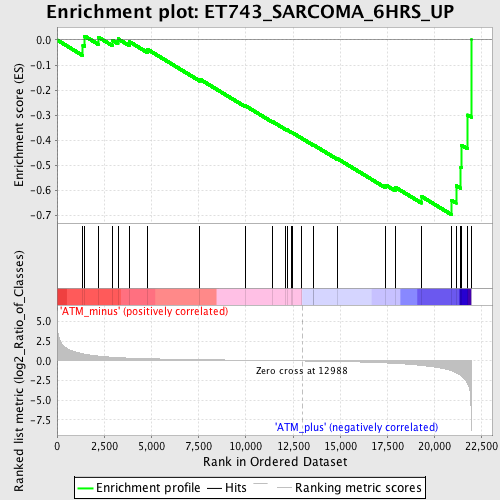
Profile of the Running ES Score & Positions of GeneSet Members on the Rank Ordered List
| Dataset | Set_02_ATM_minus_versus_ATM_plus.phenotype_ATM_minus_versus_ATM_plus.cls #ATM_minus_versus_ATM_plus.phenotype_ATM_minus_versus_ATM_plus.cls #ATM_minus_versus_ATM_plus_repos |
| Phenotype | phenotype_ATM_minus_versus_ATM_plus.cls#ATM_minus_versus_ATM_plus_repos |
| Upregulated in class | ATM_plus |
| GeneSet | ET743_SARCOMA_6HRS_UP |
| Enrichment Score (ES) | -0.6954463 |
| Normalized Enrichment Score (NES) | -1.7610091 |
| Nominal p-value | 0.0073394496 |
| FDR q-value | 0.099509574 |
| FWER p-Value | 0.672 |
| PROBE | DESCRIPTION (from dataset) | GENE SYMBOL | GENE_TITLE | RANK IN GENE LIST | RANK METRIC SCORE | RUNNING ES | CORE ENRICHMENT | |
|---|---|---|---|---|---|---|---|---|
| 1 | COX8A | 1416112_at 1436409_at 1448222_x_at | 1367 | 0.911 | -0.0202 | No | ||
| 2 | GUK1 | 1416395_at | 1462 | 0.862 | 0.0154 | No | ||
| 3 | CDC37 | 1416819_at 1416820_at | 2174 | 0.621 | 0.0117 | No | ||
| 4 | IGFBP6 | 1417933_at | 2918 | 0.462 | -0.0008 | No | ||
| 5 | ATF3 | 1449363_at | 3225 | 0.420 | 0.0046 | No | ||
| 6 | IFITM3 | 1423754_at | 3841 | 0.350 | -0.0072 | No | ||
| 7 | IFITM2 | 1417460_at | 4779 | 0.282 | -0.0369 | No | ||
| 8 | LAPTM4A | 1423368_at | 7559 | 0.164 | -0.1562 | No | ||
| 9 | VKORC1 | 1452770_at | 9956 | 0.089 | -0.2614 | No | ||
| 10 | TUSC3 | 1421662_a_at 1458568_at | 11430 | 0.047 | -0.3265 | No | ||
| 11 | GNAS | 1421740_at 1427789_s_at 1443007_at 1443375_at 1444767_at 1450186_s_at 1453413_at | 12117 | 0.027 | -0.3566 | No | ||
| 12 | COX7A2 | 1416970_a_at 1416971_at | 12175 | 0.025 | -0.3580 | No | ||
| 13 | COX6B1 | 1416565_at 1436757_a_at | 12386 | 0.019 | -0.3667 | No | ||
| 14 | IFITM1 | 1424254_at | 12464 | 0.016 | -0.3695 | No | ||
| 15 | INHBB | 1426858_at 1426859_at | 12943 | 0.002 | -0.3912 | No | ||
| 16 | MYOZ2 | 1418769_at | 13580 | -0.020 | -0.4193 | No | ||
| 17 | ITM2B | 1417999_at 1418000_a_at 1418001_at 1456372_at | 13581 | -0.020 | -0.4184 | No | ||
| 18 | SAT1 | 1420502_at | 14839 | -0.069 | -0.4726 | No | ||
| 19 | ID2 | 1422537_a_at 1435176_a_at 1453596_at | 17408 | -0.251 | -0.5782 | No | ||
| 20 | HDAC3 | 1426437_s_at | 17902 | -0.311 | -0.5863 | No | ||
| 21 | DNM1L | 1428008_at 1428086_at 1428087_at 1452638_s_at | 19293 | -0.571 | -0.6233 | No | ||
| 22 | GADD45B | 1420197_at 1449773_s_at 1450971_at | 20874 | -1.236 | -0.6382 | Yes | ||
| 23 | SOCS1 | 1440047_at 1450446_a_at | 21129 | -1.501 | -0.5803 | Yes | ||
| 24 | ANXA5 | 1425567_a_at | 21382 | -1.848 | -0.5062 | Yes | ||
| 25 | JUNB | 1415899_at | 21415 | -1.913 | -0.4192 | Yes | ||
| 26 | S100A10 | 1416762_at 1439348_at 1456642_x_at | 21746 | -2.921 | -0.2990 | Yes | ||
| 27 | FKBP1A | 1416036_at 1438795_x_at 1438958_x_at 1448184_at 1456196_x_at | 21931 | -6.642 | 0.0001 | Yes |

