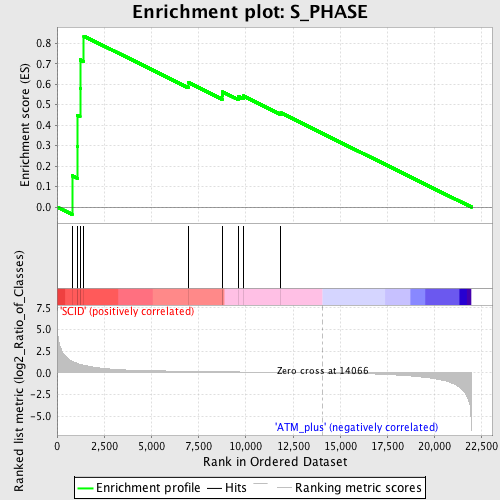
Profile of the Running ES Score & Positions of GeneSet Members on the Rank Ordered List
| Dataset | Set_01_SCID_versus_ATM_plus.phenotype_SCID_versus_ATM_plus.cls #SCID_versus_ATM_plus.phenotype_SCID_versus_ATM_plus.cls #SCID_versus_ATM_plus_repos |
| Phenotype | phenotype_SCID_versus_ATM_plus.cls#SCID_versus_ATM_plus_repos |
| Upregulated in class | SCID |
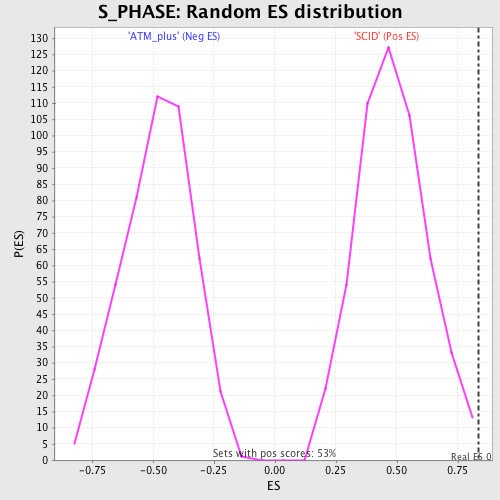
| GeneSet | S_PHASE |
| Enrichment Score (ES) | 0.8348716 |
| Normalized Enrichment Score (NES) | 1.7371184 |
| Nominal p-value | 0.0018975332 |
| FDR q-value | 0.10182067 |
| FWER p-Value | 0.631 |
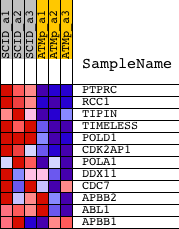
| PROBE | DESCRIPTION (from dataset) | GENE SYMBOL | GENE_TITLE | RANK IN GENE LIST | RANK METRIC SCORE | RUNNING ES | CORE ENRICHMENT | |
|---|---|---|---|---|---|---|---|---|
| 1 | PTPRC | 1422124_a_at 1440165_at | 795 | 1.337 | 0.1536 | Yes | ||
| 2 | RCC1 | 1416962_at | 1072 | 1.082 | 0.2946 | Yes | ||
| 3 | TIPIN | 1426612_at | 1087 | 1.072 | 0.4463 | Yes | ||
| 4 | TIMELESS | 1417586_at 1417587_at | 1214 | 0.985 | 0.5804 | Yes | ||
| 5 | POLD1 | 1448187_at 1456055_x_at | 1223 | 0.980 | 0.7191 | Yes | ||
| 6 | CDK2AP1 | 1426885_a_at 1435509_x_at 1456314_x_at | 1419 | 0.878 | 0.8349 | Yes | ||
| 7 | POLA1 | 1419397_at 1456285_at 1459319_at 1459963_at | 6944 | 0.180 | 0.6085 | No | ||
| 8 | DDX11 | 1438447_at 1441062_at | 8741 | 0.131 | 0.5451 | No | ||
| 9 | CDC7 | 1426002_a_at 1426021_a_at | 8770 | 0.130 | 0.5623 | No | ||
| 10 | APBB2 | 1426719_at 1426720_at 1440135_at 1446481_at 1452342_at | 9600 | 0.109 | 0.5400 | No | ||
| 11 | ABL1 | 1423999_at 1441291_at 1444134_at 1445153_at | 9860 | 0.103 | 0.5428 | No | ||
| 12 | APBB1 | 1423892_at 1423893_x_at | 11855 | 0.056 | 0.4598 | No |