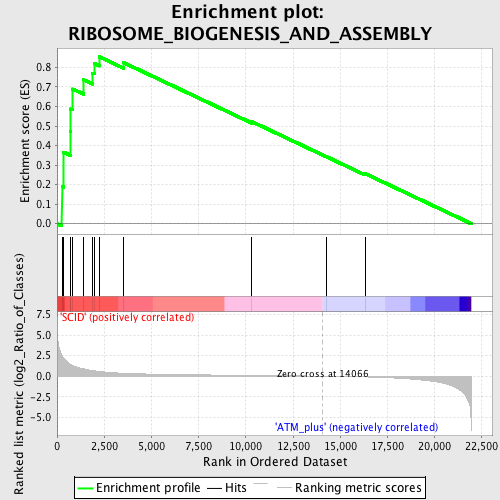
Profile of the Running ES Score & Positions of GeneSet Members on the Rank Ordered List
| Dataset | Set_01_SCID_versus_ATM_plus.phenotype_SCID_versus_ATM_plus.cls #SCID_versus_ATM_plus.phenotype_SCID_versus_ATM_plus.cls #SCID_versus_ATM_plus_repos |
| Phenotype | phenotype_SCID_versus_ATM_plus.cls#SCID_versus_ATM_plus_repos |
| Upregulated in class | SCID |
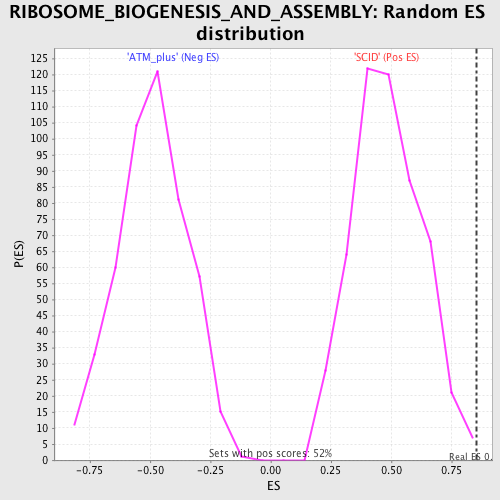
| GeneSet | RIBOSOME_BIOGENESIS_AND_ASSEMBLY |
| Enrichment Score (ES) | 0.8541863 |
| Normalized Enrichment Score (NES) | 1.7611887 |
| Nominal p-value | 0.001934236 |
| FDR q-value | 0.07482879 |
| FWER p-Value | 0.492 |
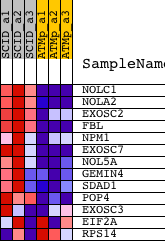
| PROBE | DESCRIPTION (from dataset) | GENE SYMBOL | GENE_TITLE | RANK IN GENE LIST | RANK METRIC SCORE | RUNNING ES | CORE ENRICHMENT | |
|---|---|---|---|---|---|---|---|---|
| 1 | NOLC1 | 1428869_at 1428870_at 1450087_a_at | 258 | 2.467 | 0.1912 | Yes | ||
| 2 | NOLA2 | 1416605_at 1416606_s_at | 345 | 2.172 | 0.3661 | Yes | ||
| 3 | EXOSC2 | 1426630_at 1446994_at | 695 | 1.461 | 0.4703 | Yes | ||
| 4 | FBL | 1416684_at 1416685_s_at | 715 | 1.431 | 0.5872 | Yes | ||
| 5 | NPM1 | 1415839_a_at 1420267_at 1420268_x_at 1420269_at 1432416_a_at | 828 | 1.306 | 0.6896 | Yes | ||
| 6 | EXOSC7 | 1448365_at | 1398 | 0.888 | 0.7367 | Yes | ||
| 7 | NOL5A | 1426533_at 1455035_s_at | 1876 | 0.677 | 0.7707 | Yes | ||
| 8 | GEMIN4 | 1433622_at | 1969 | 0.648 | 0.8198 | Yes | ||
| 9 | SDAD1 | 1437088_at 1452454_at | 2244 | 0.569 | 0.8542 | Yes | ||
| 10 | POP4 | 1448419_at | 3529 | 0.348 | 0.8242 | No | ||
| 11 | EXOSC3 | 1431502_a_at | 10307 | 0.093 | 0.5228 | No | ||
| 12 | EIF2A | 1434452_x_at 1460575_at | 14279 | -0.006 | 0.3422 | No | ||
| 13 | RPS14 | 1436586_x_at | 16313 | -0.086 | 0.2565 | No |