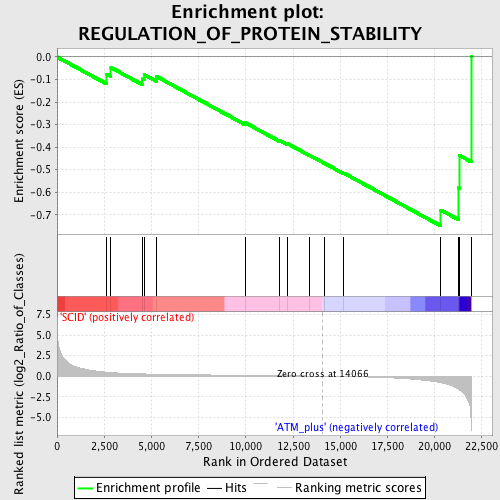
Profile of the Running ES Score & Positions of GeneSet Members on the Rank Ordered List
| Dataset | Set_01_SCID_versus_ATM_plus.phenotype_SCID_versus_ATM_plus.cls #SCID_versus_ATM_plus.phenotype_SCID_versus_ATM_plus.cls #SCID_versus_ATM_plus_repos |
| Phenotype | phenotype_SCID_versus_ATM_plus.cls#SCID_versus_ATM_plus_repos |
| Upregulated in class | ATM_plus |
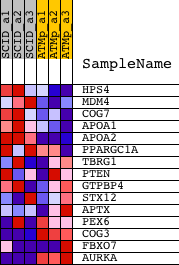
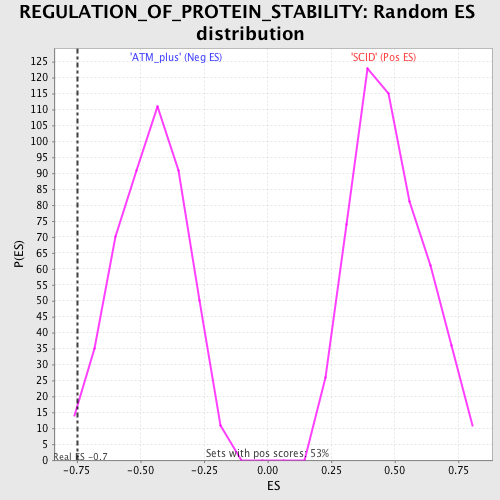
| GeneSet | REGULATION_OF_PROTEIN_STABILITY |
| Enrichment Score (ES) | -0.7495486 |
| Normalized Enrichment Score (NES) | -1.6209948 |
| Nominal p-value | 0.014799154 |
| FDR q-value | 0.3426449 |
| FWER p-Value | 0.992 |
| PROBE | DESCRIPTION (from dataset) | GENE SYMBOL | GENE_TITLE | RANK IN GENE LIST | RANK METRIC SCORE | RUNNING ES | CORE ENRICHMENT | |
|---|---|---|---|---|---|---|---|---|
| 1 | HPS4 | 1448629_at | 2617 | 0.485 | -0.0760 | No | ||
| 2 | MDM4 | 1419558_at 1453982_at 1460542_s_at | 2852 | 0.443 | -0.0470 | No | ||
| 3 | COG7 | 1443486_at | 4505 | 0.275 | -0.0977 | No | ||
| 4 | APOA1 | 1419232_a_at 1419233_x_at 1438840_x_at 1455201_x_at | 4604 | 0.271 | -0.0779 | No | ||
| 5 | APOA2 | 1417950_a_at | 5242 | 0.242 | -0.0853 | No | ||
| 6 | PPARGC1A | 1434099_at 1434100_x_at 1437751_at 1456395_at 1460336_at | 9955 | 0.101 | -0.2912 | No | ||
| 7 | TBRG1 | 1452648_at | 11801 | 0.057 | -0.3702 | No | ||
| 8 | PTEN | 1422553_at 1441593_at 1444325_at 1450655_at 1454722_at 1455728_at 1457493_at | 12225 | 0.047 | -0.3853 | No | ||
| 9 | GTPBP4 | 1423142_a_at 1423143_at 1450873_at | 13357 | 0.019 | -0.4352 | No | ||
| 10 | STX12 | 1435982_at 1448936_at | 14156 | -0.003 | -0.4714 | No | ||
| 11 | APTX | 1450921_at | 15178 | -0.036 | -0.5147 | No | ||
| 12 | PEX6 | 1424078_s_at 1438138_a_at 1451226_at 1454738_x_at 1456302_at | 20327 | -0.791 | -0.6787 | Yes | ||
| 13 | COG3 | 1434654_at 1456286_at | 21260 | -1.567 | -0.5810 | Yes | ||
| 14 | FBXO7 | 1435310_at 1435311_s_at 1452739_at | 21312 | -1.635 | -0.4368 | Yes | ||
| 15 | AURKA | 1424511_at 1440129_at | 21926 | -5.196 | 0.0005 | Yes |