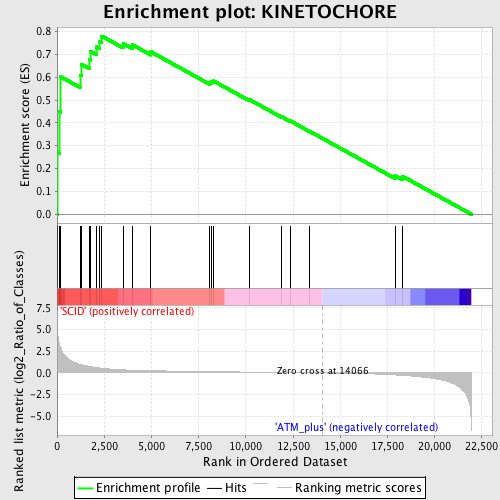
Profile of the Running ES Score & Positions of GeneSet Members on the Rank Ordered List
| Dataset | Set_01_SCID_versus_ATM_plus.phenotype_SCID_versus_ATM_plus.cls #SCID_versus_ATM_plus.phenotype_SCID_versus_ATM_plus.cls #SCID_versus_ATM_plus_repos |
| Phenotype | phenotype_SCID_versus_ATM_plus.cls#SCID_versus_ATM_plus_repos |
| Upregulated in class | SCID |
| GeneSet | KINETOCHORE |
| Enrichment Score (ES) | 0.7796232 |
| Normalized Enrichment Score (NES) | 1.8440268 |
| Nominal p-value | 0.0 |
| FDR q-value | 0.048058465 |
| FWER p-Value | 0.123 |
| PROBE | DESCRIPTION (from dataset) | GENE SYMBOL | GENE_TITLE | RANK IN GENE LIST | RANK METRIC SCORE | RUNNING ES | CORE ENRICHMENT | |
|---|---|---|---|---|---|---|---|---|
| 1 | BUB3 | 1416815_s_at 1448058_s_at 1448473_at 1459104_at 1459918_at | 24 | 4.996 | 0.2713 | Yes | ||
| 2 | SUMO3 | 1422457_s_at 1439372_at | 113 | 3.345 | 0.4498 | Yes | ||
| 3 | ZWINT | 1423724_at 1427539_a_at 1427540_at 1429786_a_at 1429787_x_at 1444717_at 1455382_at | 195 | 2.844 | 0.6012 | Yes | ||
| 4 | KIF22 | 1423813_at 1437716_x_at 1451128_s_at | 1217 | 0.983 | 0.6082 | Yes | ||
| 5 | PMF1 | 1416707_a_at 1438173_x_at | 1284 | 0.944 | 0.6566 | Yes | ||
| 6 | CENPE | 1435005_at 1439040_at | 1719 | 0.732 | 0.6768 | Yes | ||
| 7 | BUB1B | 1416961_at 1447362_at 1447363_s_at | 1775 | 0.711 | 0.7131 | Yes | ||
| 8 | MAD2L1 | 1422460_at | 2085 | 0.611 | 0.7323 | Yes | ||
| 9 | APC | 1420956_at 1420957_at 1435543_at 1450056_at | 2267 | 0.562 | 0.7547 | Yes | ||
| 10 | BUB1 | 1424046_at 1438571_at | 2364 | 0.538 | 0.7796 | Yes | ||
| 11 | CLASP1 | 1427353_at 1452265_at 1459233_at 1460102_at | 3497 | 0.351 | 0.7471 | No | ||
| 12 | ZWILCH | 1416757_at | 3983 | 0.310 | 0.7419 | No | ||
| 13 | PSEN2 | 1425869_a_at 1431542_at | 4969 | 0.254 | 0.7108 | No | ||
| 14 | ZW10 | 1424891_a_at 1431747_at 1445206_at | 8066 | 0.147 | 0.5775 | No | ||
| 15 | PAFAH1B1 | 1417086_at 1427703_at 1439656_at 1441404_at 1444125_at 1448578_at 1456947_at 1460199_a_at | 8167 | 0.145 | 0.5809 | No | ||
| 16 | SMC1A | 1417830_at 1417831_at 1417832_at | 8283 | 0.142 | 0.5834 | No | ||
| 17 | PSEN1 | 1420261_at 1421853_at 1425549_at 1450399_at | 10173 | 0.095 | 0.5024 | No | ||
| 18 | DCTN2 | 1424461_at | 11901 | 0.055 | 0.4266 | No | ||
| 19 | CENPC1 | 1420441_at | 12337 | 0.045 | 0.4091 | No | ||
| 20 | SUGT1 | 1426424_at 1426425_at 1446757_at | 13348 | 0.019 | 0.3641 | No | ||
| 21 | CENPF | 1427161_at 1452334_at 1458447_at | 17928 | -0.227 | 0.1676 | No | ||
| 22 | MIS12 | 1424717_at | 18292 | -0.280 | 0.1663 | No |

