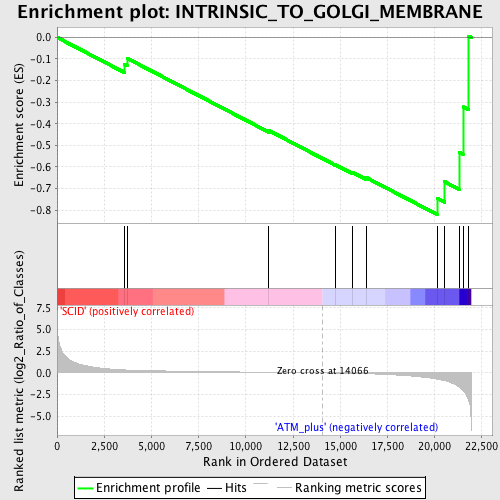
Profile of the Running ES Score & Positions of GeneSet Members on the Rank Ordered List
| Dataset | Set_01_SCID_versus_ATM_plus.phenotype_SCID_versus_ATM_plus.cls #SCID_versus_ATM_plus.phenotype_SCID_versus_ATM_plus.cls #SCID_versus_ATM_plus_repos |
| Phenotype | phenotype_SCID_versus_ATM_plus.cls#SCID_versus_ATM_plus_repos |
| Upregulated in class | ATM_plus |
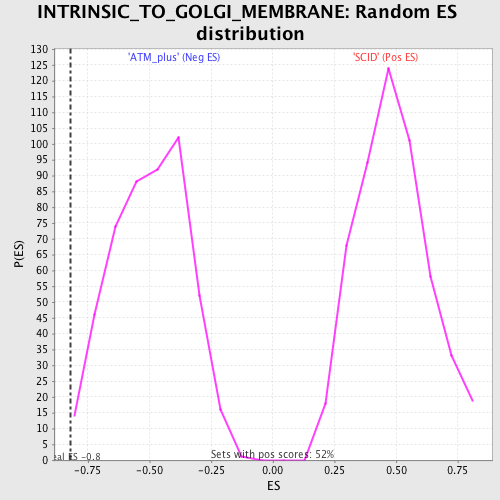
| GeneSet | INTRINSIC_TO_GOLGI_MEMBRANE |
| Enrichment Score (ES) | -0.82010317 |
| Normalized Enrichment Score (NES) | -1.6504192 |
| Nominal p-value | 0.0041237115 |
| FDR q-value | 0.29791182 |
| FWER p-Value | 0.976 |
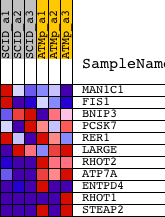
| PROBE | DESCRIPTION (from dataset) | GENE SYMBOL | GENE_TITLE | RANK IN GENE LIST | RANK METRIC SCORE | RUNNING ES | CORE ENRICHMENT | |
|---|---|---|---|---|---|---|---|---|
| 1 | MAN1C1 | 1436193_at | 3579 | 0.343 | -0.1265 | No | ||
| 2 | FIS1 | 1416764_at 1443819_x_at | 3708 | 0.332 | -0.0968 | No | ||
| 3 | BNIP3 | 1422470_at | 11206 | 0.072 | -0.4310 | No | ||
| 4 | PCSK7 | 1417180_at | 14739 | -0.021 | -0.5898 | No | ||
| 5 | RER1 | 1460660_x_at 1460706_s_at | 15629 | -0.053 | -0.6247 | No | ||
| 6 | LARGE | 1417435_at 1417436_at 1441642_at 1442420_at 1443212_at 1458663_at | 16365 | -0.089 | -0.6486 | No | ||
| 7 | RHOT2 | 1426822_at | 20126 | -0.705 | -0.7447 | Yes | ||
| 8 | ATP7A | 1418774_a_at 1436921_at | 20523 | -0.881 | -0.6684 | Yes | ||
| 9 | ENTPD4 | 1431761_at 1438177_x_at 1447900_x_at 1449190_a_at | 21293 | -1.612 | -0.5310 | Yes | ||
| 10 | RHOT1 | 1423533_a_at 1440853_at | 21504 | -2.042 | -0.3221 | Yes | ||
| 11 | STEAP2 | 1428636_at 1438773_at 1442359_at 1444290_at 1446071_at | 21806 | -3.194 | 0.0059 | Yes |