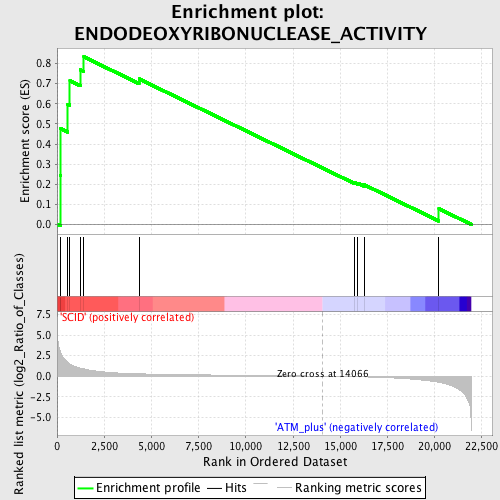
Profile of the Running ES Score & Positions of GeneSet Members on the Rank Ordered List
| Dataset | Set_01_SCID_versus_ATM_plus.phenotype_SCID_versus_ATM_plus.cls #SCID_versus_ATM_plus.phenotype_SCID_versus_ATM_plus.cls #SCID_versus_ATM_plus_repos |
| Phenotype | phenotype_SCID_versus_ATM_plus.cls#SCID_versus_ATM_plus_repos |
| Upregulated in class | SCID |
| GeneSet | ENDODEOXYRIBONUCLEASE_ACTIVITY |
| Enrichment Score (ES) | 0.8333499 |
| Normalized Enrichment Score (NES) | 1.6973389 |
| Nominal p-value | 0.0037807184 |
| FDR q-value | 0.13494042 |
| FWER p-Value | 0.848 |
| PROBE | DESCRIPTION (from dataset) | GENE SYMBOL | GENE_TITLE | RANK IN GENE LIST | RANK METRIC SCORE | RUNNING ES | CORE ENRICHMENT | |
|---|---|---|---|---|---|---|---|---|
| 1 | DNASE2 | 1430135_at 1448986_x_at | 165 | 3.035 | 0.2430 | Yes | ||
| 2 | FEN1 | 1421731_a_at 1436454_x_at | 196 | 2.841 | 0.4762 | Yes | ||
| 3 | APEX1 | 1416135_at 1437715_x_at 1456079_x_at | 567 | 1.683 | 0.5982 | Yes | ||
| 4 | EXO1 | 1418026_at 1418027_at | 680 | 1.472 | 0.7147 | Yes | ||
| 5 | OGG1 | 1430078_a_at 1448815_at | 1247 | 0.966 | 0.7686 | Yes | ||
| 6 | RAD50 | 1422630_at 1425939_at 1458970_at | 1418 | 0.878 | 0.8333 | Yes | ||
| 7 | MBD4 | 1449490_at 1457708_at | 4342 | 0.286 | 0.7236 | No | ||
| 8 | ERCC4 | 1432272_a_at 1440237_at 1441003_at 1448984_at | 15776 | -0.060 | 0.2071 | No | ||
| 9 | ERCC5 | 1450935_at 1457713_at | 15933 | -0.067 | 0.2056 | No | ||
| 10 | ERCC1 | 1417328_at 1437447_s_at 1441838_at 1445266_at | 16270 | -0.084 | 0.1972 | No | ||
| 11 | MRE11A | 1416748_a_at 1441990_at 1458509_at | 20223 | -0.742 | 0.0781 | No |

